File:EP-D1.2-Fig9-Post-MQflush-behavior.png
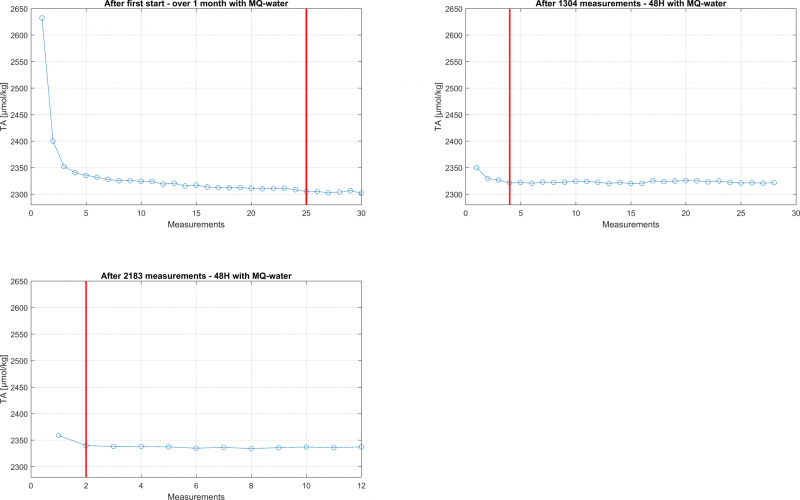
Revision as of 05:17, 8 September 2020 by Alexander Zilliacus (talk | contribs) (Figure 9: Behaviour of the drift after MQ-Flush of the system (measurements after red vertical line = stable (Std-Dev. < 2 µmol/kg)) Category:Images)

Size of this preview: 800 × 500 pixels. Other resolutions: 320 × 200 pixels | 2,132 × 1,332 pixels.
Original file (2,132 × 1,332 pixels, file size: 155 KB, MIME type: image/png)
Summary[edit]
Figure 9: Behaviour of the drift after MQ-Flush of the system (measurements after red vertical line = stable (Std-Dev. < 2 µmol/kg))
File history
Click on a date/time to view the file as it appeared at that time.
| Date/Time | Thumbnail | Dimensions | User | Comment | |
|---|---|---|---|---|---|
| current | 05:17, 8 September 2020 | | 2,132 × 1,332 (155 KB) | Alexander Zilliacus (talk | contribs) | Figure 9: Behaviour of the drift after MQ-Flush of the system (measurements after red vertical line = stable (Std-Dev. < 2 µmol/kg)) Category:Images |
- You cannot overwrite this file.
File usage
The following page links to this file: