File:EP-D1.4-Fig2-EARLINET-stations.jpg
Revision as of 05:17, 7 September 2020 by Alexander Zilliacus (talk | contribs)
Size of this preview: 602 × 600 pixels. Other resolutions: 241 × 240 pixels | 738 × 735 pixels.
Original file (738 × 735 pixels, file size: 73 KB, MIME type: image/jpeg)
Summary
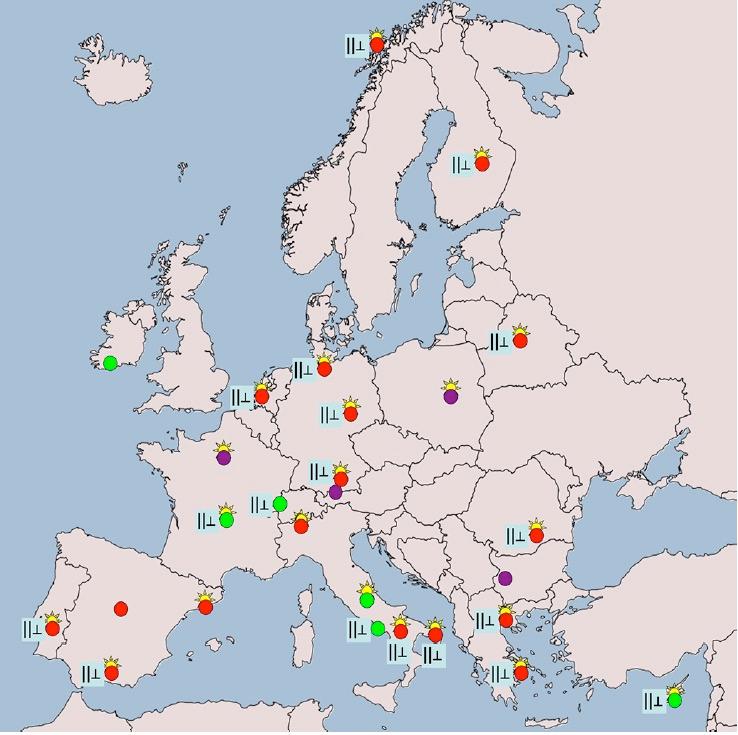
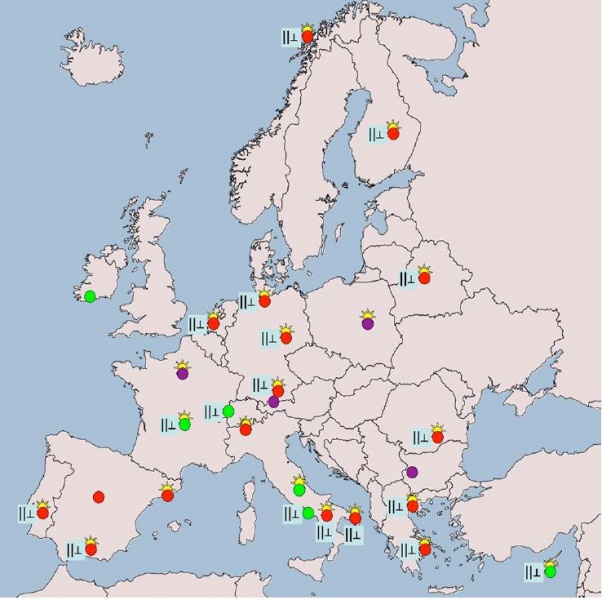
ENVRIplus D1.4 Report on integration across networks: common strategy and common sensors for lidar and aerosol extinction measurements.
Figure 2: Map of the earlinet stations currently active. Red dots indicate multi wavelength raman LIDAR stations (EARLINET core stations). Green dots correspond to stations with at least one raman channel. Violet dots denote LIDARs with only elastic backscatter channels. The ||⊥ symbol indicates that the station has depolarization-measurement capabilities. The "sun" (☀) symbol means collocation with an AERONET sun photometer[1]. Adapted From (Pappalardo Et Al., 2014)
File history
Click on a date/time to view the file as it appeared at that time.
| Date/Time | Thumbnail | Dimensions | User | Comment | |
|---|---|---|---|---|---|
| current | 05:14, 7 September 2020 | | 738 × 735 (73 KB) | Alexander Zilliacus (talk | contribs) | Category:Images |
- You cannot overwrite this file.
File usage
The following page links to this file: