Difference between revisions of "File:EP-D1.4-Fig7B-Linear-regression.png"
(Figure 7: Linear regression analysis and associated scatter-plots of the profile data. About 60% of the variance of the residuals of the Mie calculation is explained by the linear regression (right) the remaining variance is caused due to the cut offs...) |
m |
||
| Line 1: | Line 1: | ||
== Summary == | == Summary == | ||
Figure 7: Linear regression analysis and associated scatter-plots of the profile data. About 60% of the variance of the residuals of the Mie calculation is explained by the linear regression (right) the remaining variance is caused due to the cut offs of the size measurement. | Figure 7: Linear regression analysis and associated scatter-plots of the profile data. About 60% of the variance of the residuals of the Mie calculation is explained by the linear regression (right) the remaining variance is caused due to the cut offs of the size measurement. | ||
| + | |||
| + | [[Category:Images]] | ||
Latest revision as of 07:20, 7 September 2020
Summary[edit]
Figure 7: Linear regression analysis and associated scatter-plots of the profile data. About 60% of the variance of the residuals of the Mie calculation is explained by the linear regression (right) the remaining variance is caused due to the cut offs of the size measurement.
File history
Click on a date/time to view the file as it appeared at that time.
| Date/Time | Thumbnail | Dimensions | User | Comment | |
|---|---|---|---|---|---|
| current | 05:37, 7 September 2020 | 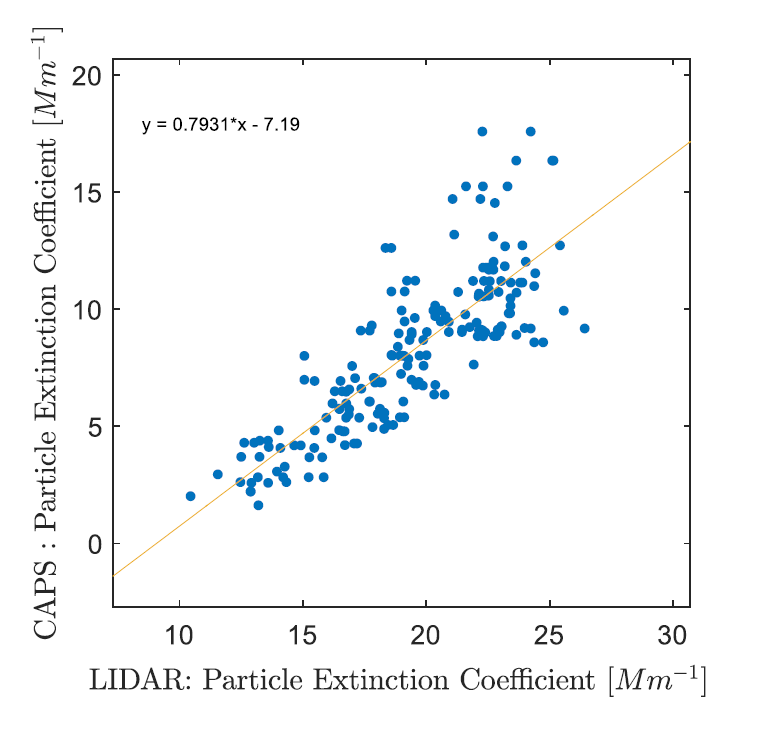 | 775 × 752 (40 KB) | Alexander Zilliacus (talk | contribs) | Figure 7: Linear regression analysis and associated scatter-plots of the profile data. About 60% of the variance of the residuals of the Mie calculation is explained by the linear regression (right) the remaining variance is caused due to the cut offs... |
- You cannot overwrite this file.
File usage
The following page links to this file: