File:EP-D1.4-Fig6-Height-profiles.png
Revision as of 05:36, 7 September 2020 by Alexander Zilliacus (talk | contribs) (Figure 6: Height profiles of the LIDAR data are wavelength corrected to 630nm using an Angstrom Coefficient of 1.6 measured by a sun photometer in Lindenberg. The linear correlation CAPS vs LIDAR shows an linear factor of 0,79 which is corrected in thi...)

Size of this preview: 495 × 599 pixels. Other resolutions: 198 × 240 pixels | 704 × 852 pixels.
Original file (704 × 852 pixels, file size: 54 KB, MIME type: image/png)
Summary
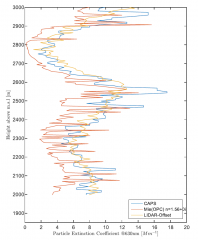
Figure 6: Height profiles of the LIDAR data are wavelength corrected to 630nm using an Angstrom Coefficient of 1.6 measured by a sun photometer in Lindenberg. The linear correlation CAPS vs LIDAR shows an linear factor of 0,79 which is corrected in this plot. This factor is caused by the humidity effect on scattering.
File history
Click on a date/time to view the file as it appeared at that time.
| Date/Time | Thumbnail | Dimensions | User | Comment | |
|---|---|---|---|---|---|
| current | 05:36, 7 September 2020 | | 704 × 852 (54 KB) | Alexander Zilliacus (talk | contribs) | Figure 6: Height profiles of the LIDAR data are wavelength corrected to 630nm using an Angstrom Coefficient of 1.6 measured by a sun photometer in Lindenberg. The linear correlation CAPS vs LIDAR shows an linear factor of 0,79 which is corrected in thi... |
- You cannot overwrite this file.
File usage
The following page links to this file: