File list
This special page shows all uploaded files.
| Date | Name | Thumbnail | Size | Description | Versions |
|---|---|---|---|---|---|
| 12:00, 19 August 2020 | ENVRIplus logo.jpg (file) | 40 KB | The shortform (ie. containing only the abbreviation) of the ENVRIPlus project logotype. | 1 | |
| 09:20, 24 August 2020 | ENVRI-community-logo.jpg (file) | 286 KB | The short version of the ENVRI Community logo. | 1 | |
| 10:46, 25 August 2020 | ENVRI-FAIR logo.jpg (file) | 505 KB | Colour logotype of the ENVRI-FAIR project. | 1 | |
| 08:14, 26 August 2020 | ENVRI logo.jpg (file) | 11 KB | The logo of the ENVRI project (2011–2014). | 1 | |
| 06:57, 27 August 2020 | COOPplus logo.jpg (file) | 22 KB | Logo of the COOP+ project (2016–2018). | 1 | |
| 11:22, 27 August 2020 | 1280px-Flag of Europe.png (file) |  |
29 KB | Flag of the European Union. | 1 |
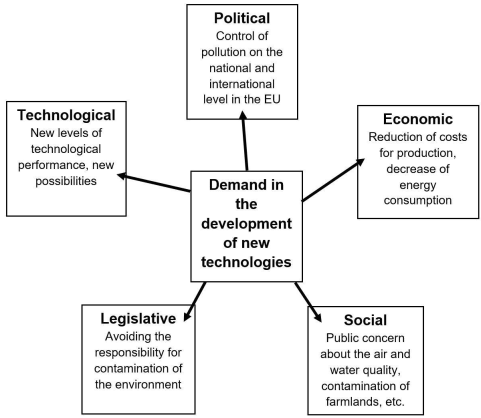
| 12:18, 1 September 2020 | ENVRIplus D1.1-Fig. 1-Factors influencing the development of technology.png (file) |  |
61 KB | ENVRIplus Deliverable 1.1 (Emerging technologies, emerging markets – fostering the innovation potential of research infrastructures) figure 1: Factors influencing the development of technology. Category:Images | 1 |
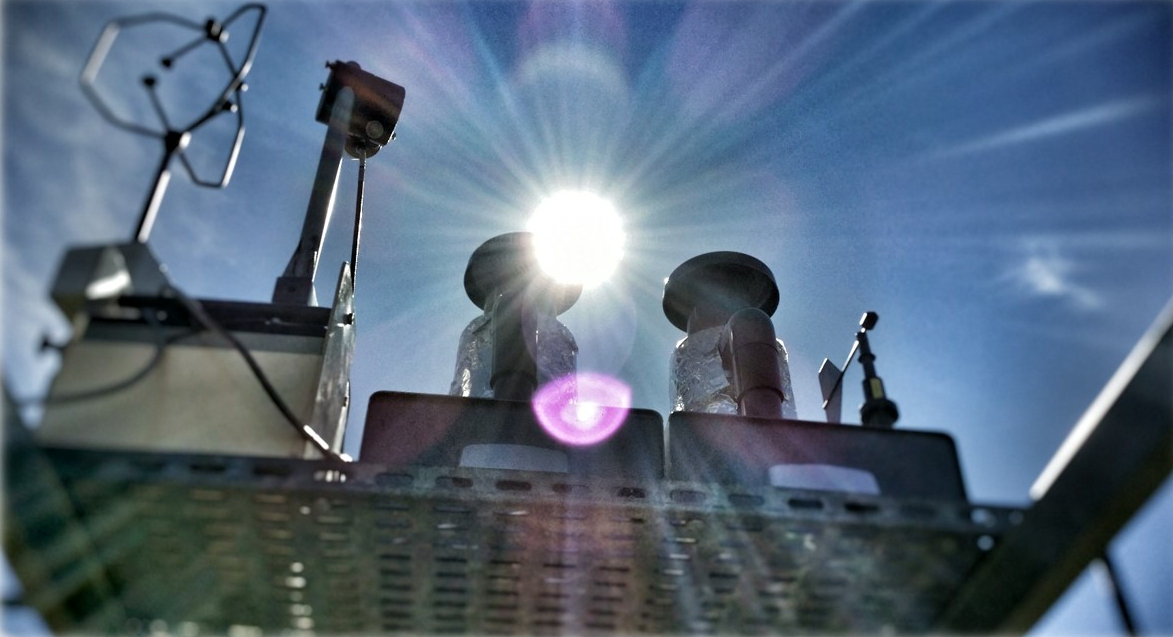
| 12:22, 1 September 2020 | ENVRIplus D1.1-Fig. 2-Eddy covariance technique on-site.png (file) |  |
1.59 MB | 1 | |
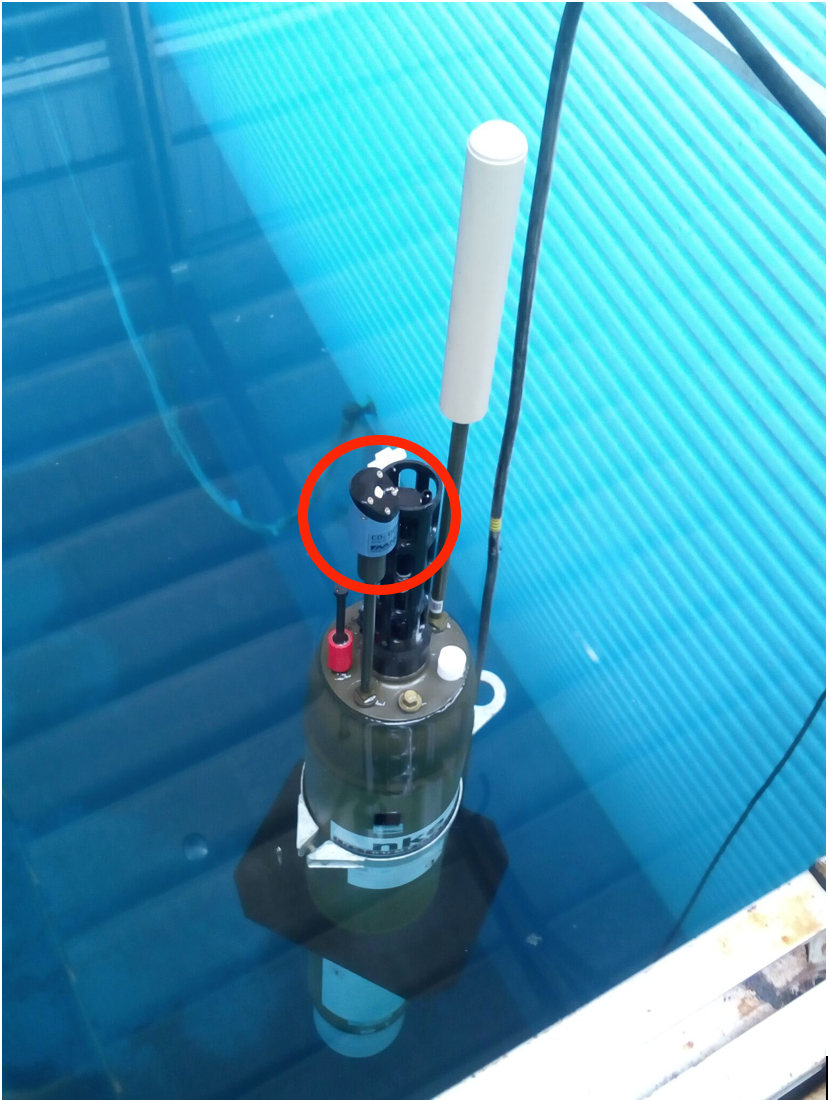
| 12:23, 1 September 2020 | ENVRIplus D1.1-Fig. 3-The Aanderaa optode sensor on a provor float.png (file) |  |
1.93 MB | Category:Images | 1 |
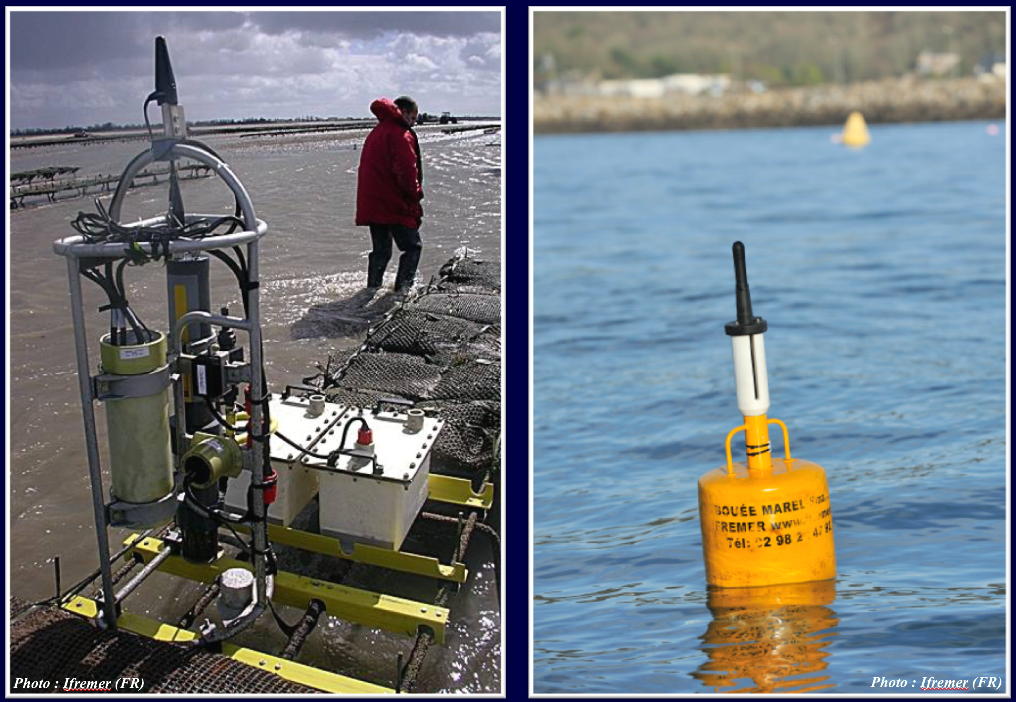
| 12:23, 1 September 2020 | ENVRIplus D1.1-Fig. 4-TRIOS fluorometers equipped with Ifremer antifouling devices.png (file) |  |
83 KB | Category:Images | 1 |
| 12:24, 1 September 2020 | ENVRIplus D1.1-Fig. 5-Fouling on the sensors is the main constrains for in situ ocean autonomous measurements.png (file) |  |
1.79 MB | Category:Images | 1 |
| 12:24, 1 September 2020 | ENVRIplus D1.1-Fig. 6-Multiparameter system for sea measurements.png (file) |  |
1.65 MB | Category:Images | 1 |
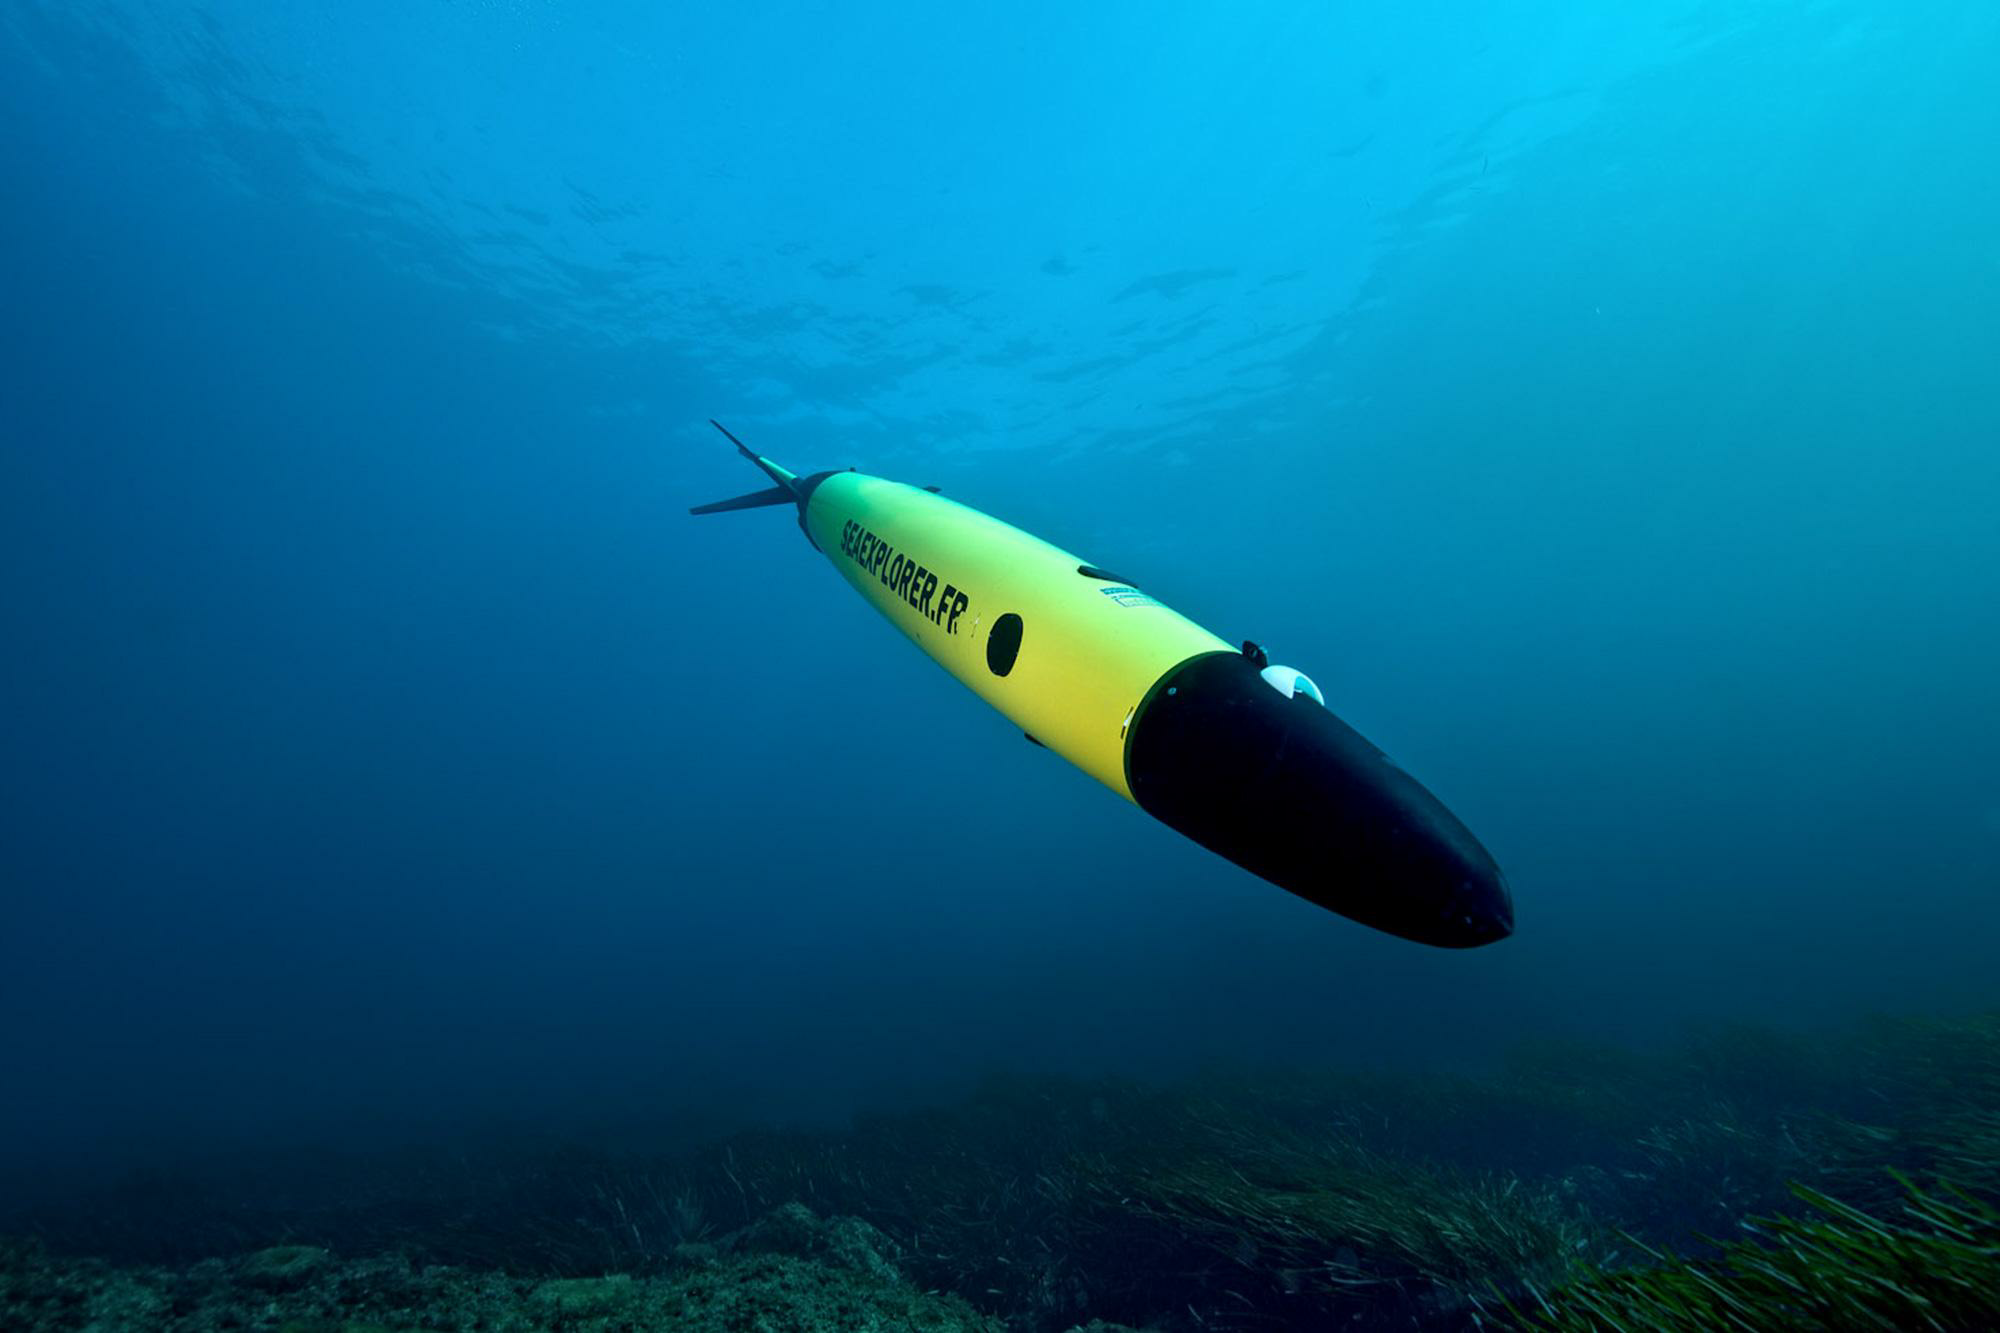
| 12:26, 1 September 2020 | ENVRIplus D1.1-Fig. 7A-Drones for underwater measurements, (A) Sea explorer, (B) Seaglider.png (file) | _Sea_explorer,_(B)_Seaglider.png) |
1.75 MB | Category:Images | 1 |
| 12:27, 1 September 2020 | ENVRIplus D1.1-Fig. 7B-Drones for underwater measurements, (A) Sea explorer, (B) Seaglider.png (file) | _Sea_explorer,_(B)_Seaglider.png) |
1.38 MB | Category:Images | 1 |
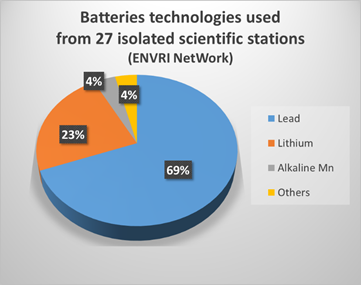
| 12:27, 1 September 2020 | ENVRIplus D1.1-Fig. 9-Power storage systems. ENVRIplus WP 3.1 'Energy report', 2017.png (file) |  |
73 KB | Category:Images | 1 |
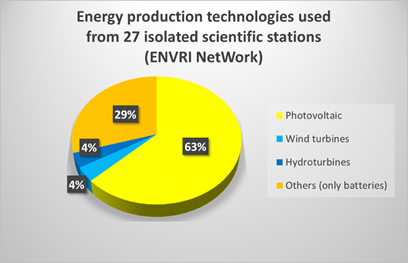
| 12:27, 1 September 2020 | ENVRIplus D1.1-Fig. 8-Power supply systems. ENVRIplus WP 3.1 'Energy report', 2017.png (file) |  |
73 KB | Category:Images | 1 |
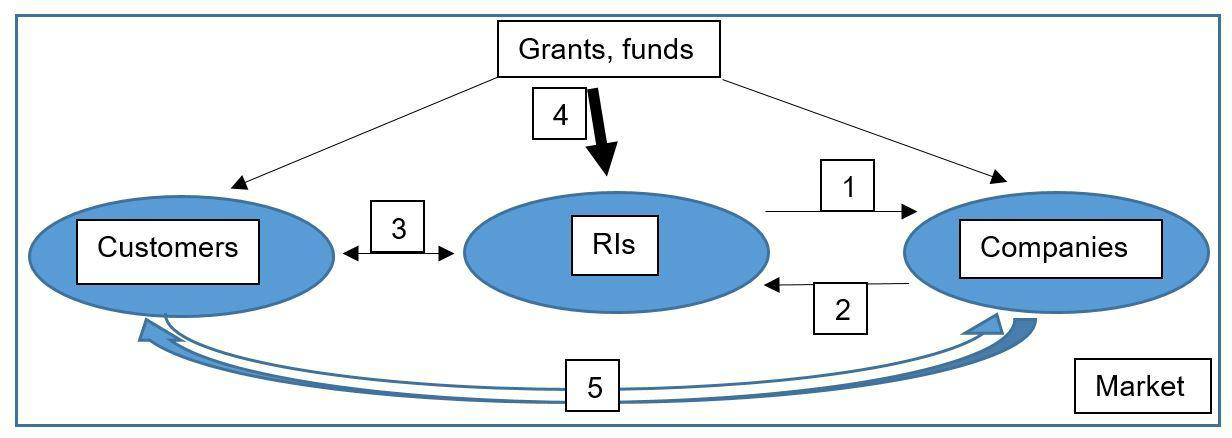
| 12:27, 1 September 2020 | ENVRIplus D1.1-Fig. 10-Interactions of RIs with other participants in the market.png (file) |  |
223 KB | Category:Images | 1 |
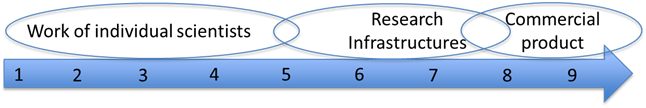
| 12:28, 1 September 2020 | ENVRIplus D1.1-Fig. 11-Technology readiness level Axis (1-9) and stages of the technological product.png (file) | 36 KB | Category:Images | 1 | |
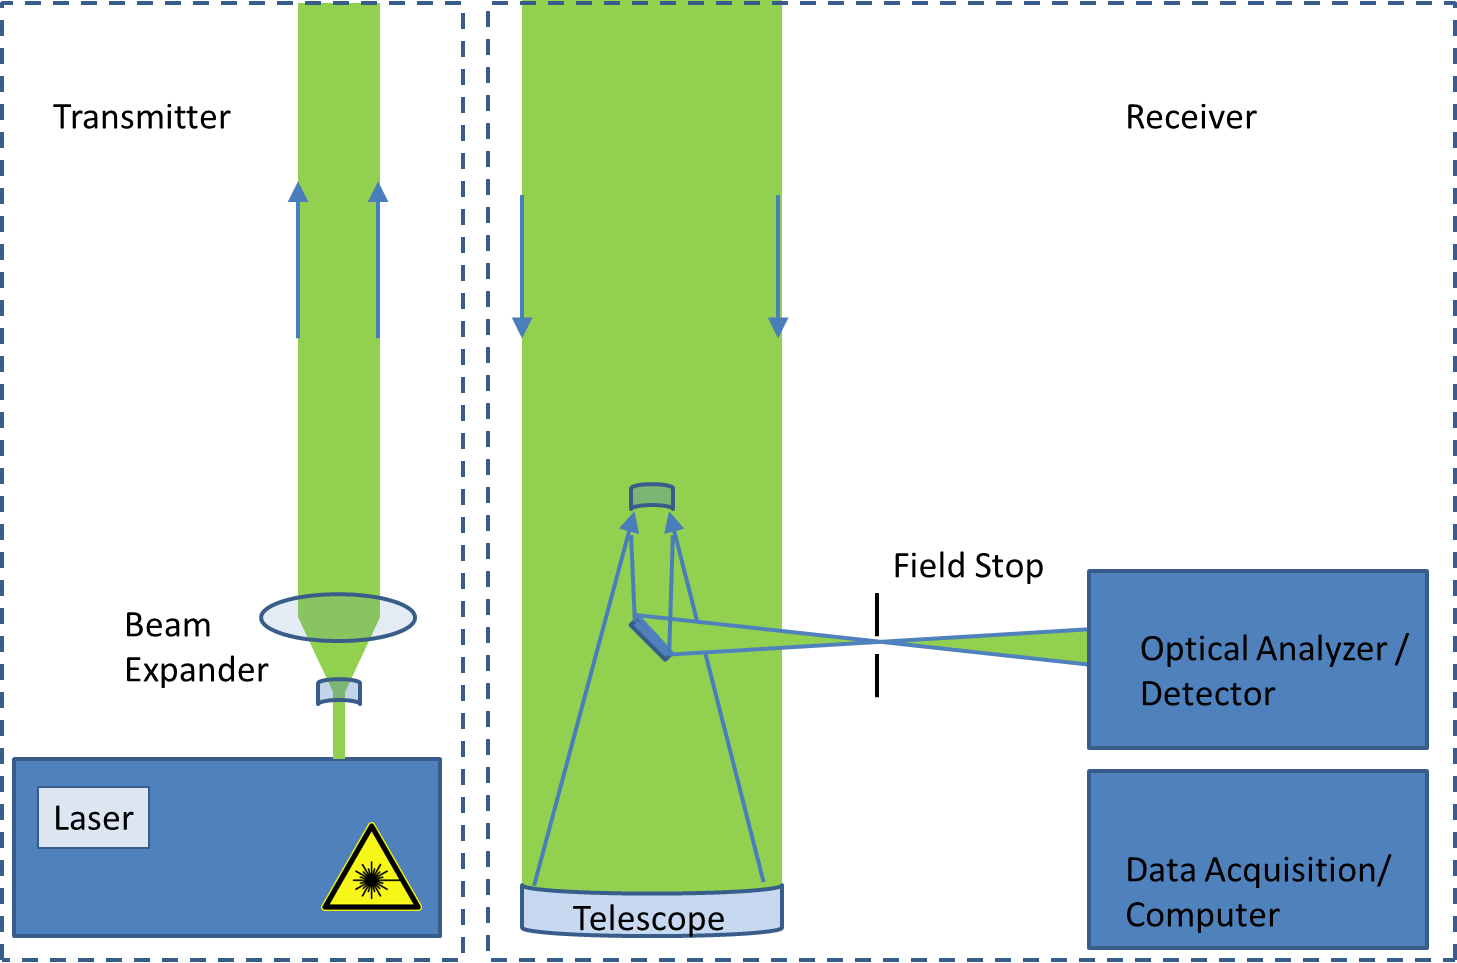
| 05:13, 7 September 2020 | EP-D1.4-Fig1-LIDAR-setup.png (file) |  |
82 KB | Category:Images | 1 |
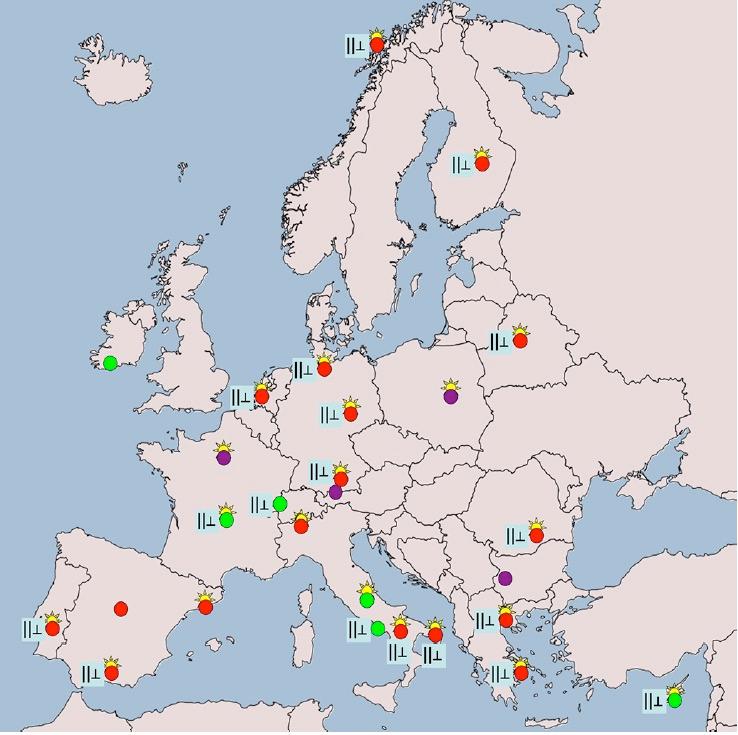
| 05:14, 7 September 2020 | EP-D1.4-Fig2-EARLINET-stations.jpg (file) |  |
73 KB | Category:Images | 1 |
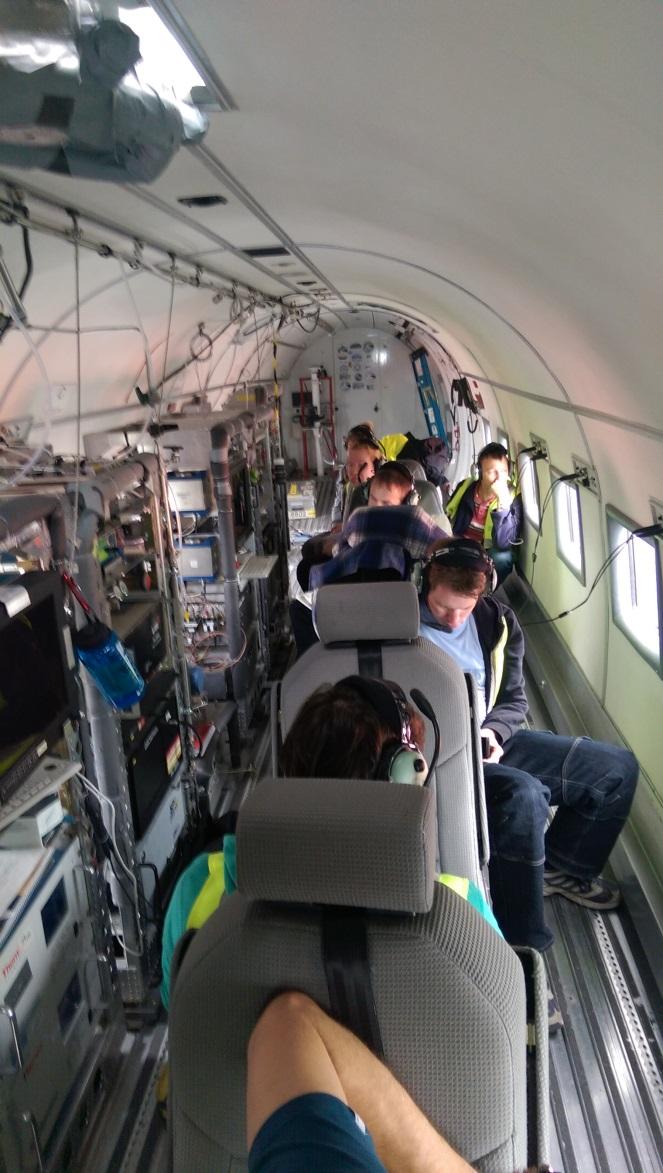
| 05:20, 7 September 2020 | EP-D1.4-Fig4-IAGOS-Polar6.jpg (file) |  |
184 KB | Figure 4: Installation on Polar6 aircraft | 1 |
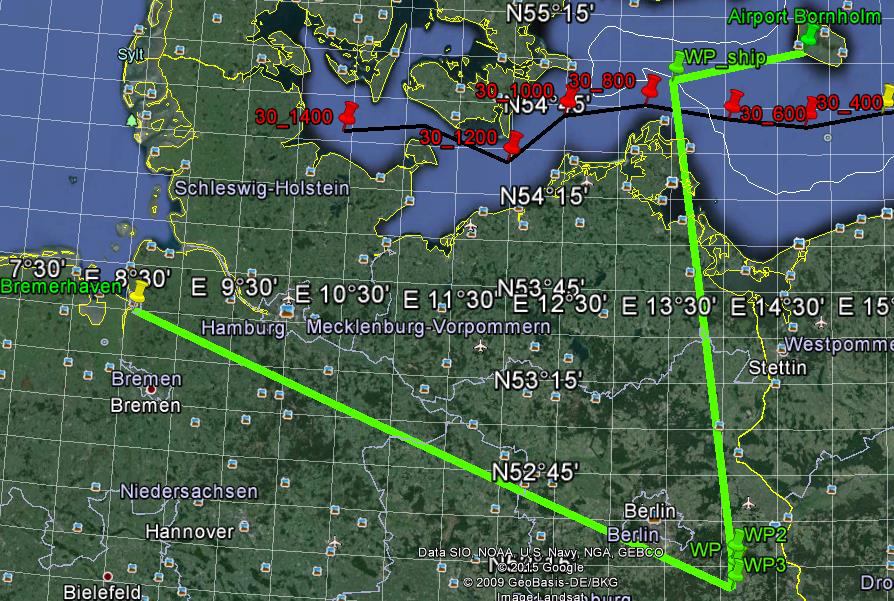
| 05:20, 7 September 2020 | EP-D1.4-Fig5A-Bornholm-Bremerhaven.png (file) |  |
1.23 MB | Figure 5: Flight track Bornholm Bremerhaven via Lindenberg observatory site | 1 |
| 05:20, 7 September 2020 | EP-D1.4-Fig5B-Bornholm-Bremerhaven.jpg (file) |  |
103 KB | Figure 6: Height profiles of the LIDAR data are wavelength corrected to 630nm using an Angstrom Coefficient of 1.6 measured by a sun photometer in Lindenberg. The linear correlation CAPS vs LIDAR shows an linear factor of 0,79 which is corrected in thi... | 1 |
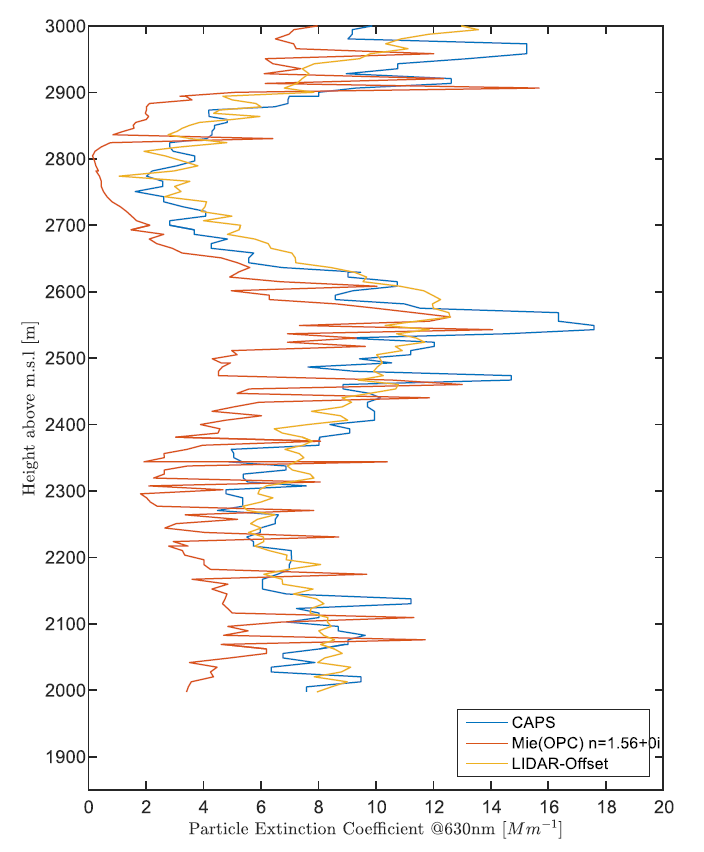
| 05:36, 7 September 2020 | EP-D1.4-Fig6-Height-profiles.png (file) |  |
54 KB | Figure 6: Height profiles of the LIDAR data are wavelength corrected to 630nm using an Angstrom Coefficient of 1.6 measured by a sun photometer in Lindenberg. The linear correlation CAPS vs LIDAR shows an linear factor of 0,79 which is corrected in thi... | 1 |
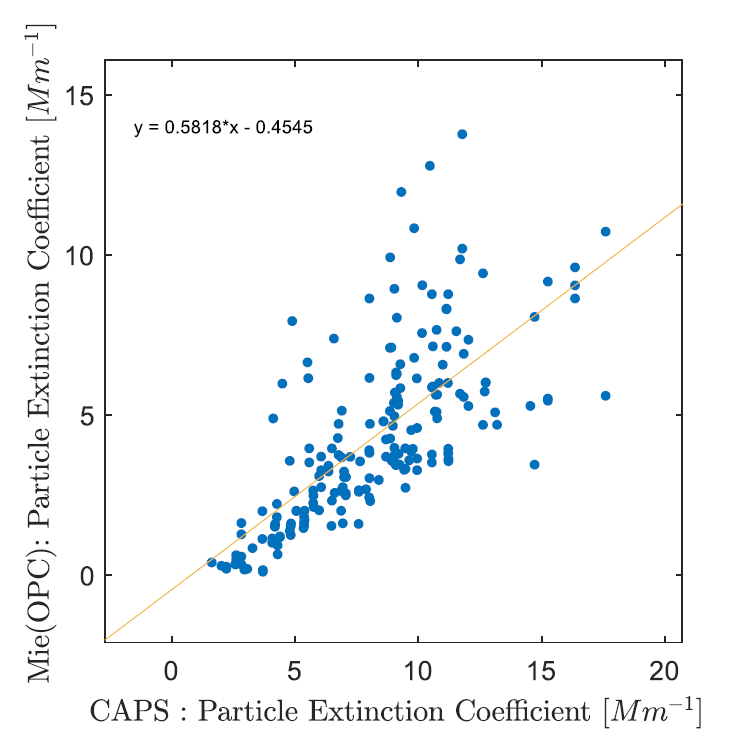
| 05:36, 7 September 2020 | EP-D1.4-Fig7A-Linear-regression.png (file) |  |
40 KB | Figure 7: Linear regression analysis and associated scatter-plots of the profile data. About 60% of the variance of the residuals of the Mie calculation is explained by the linear regression (right) the remaining variance is caused due to the cut offs... | 1 |
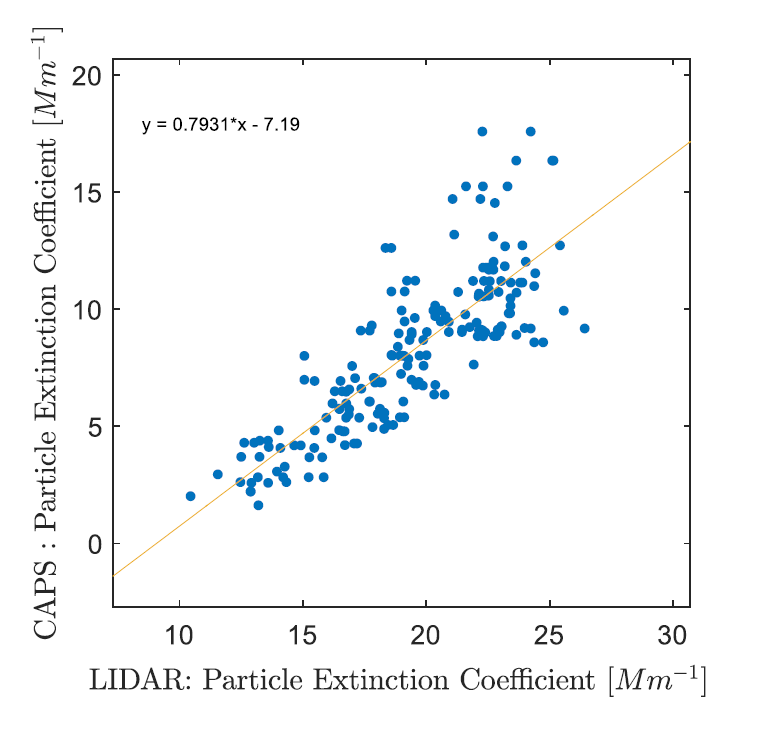
| 05:37, 7 September 2020 | EP-D1.4-Fig7B-Linear-regression.png (file) |  |
40 KB | Figure 7: Linear regression analysis and associated scatter-plots of the profile data. About 60% of the variance of the residuals of the Mie calculation is explained by the linear regression (right) the remaining variance is caused due to the cut offs... | 1 |
| 07:17, 7 September 2020 | EP-D1.4-Fig3A-CAPS-method.png (file) |  |
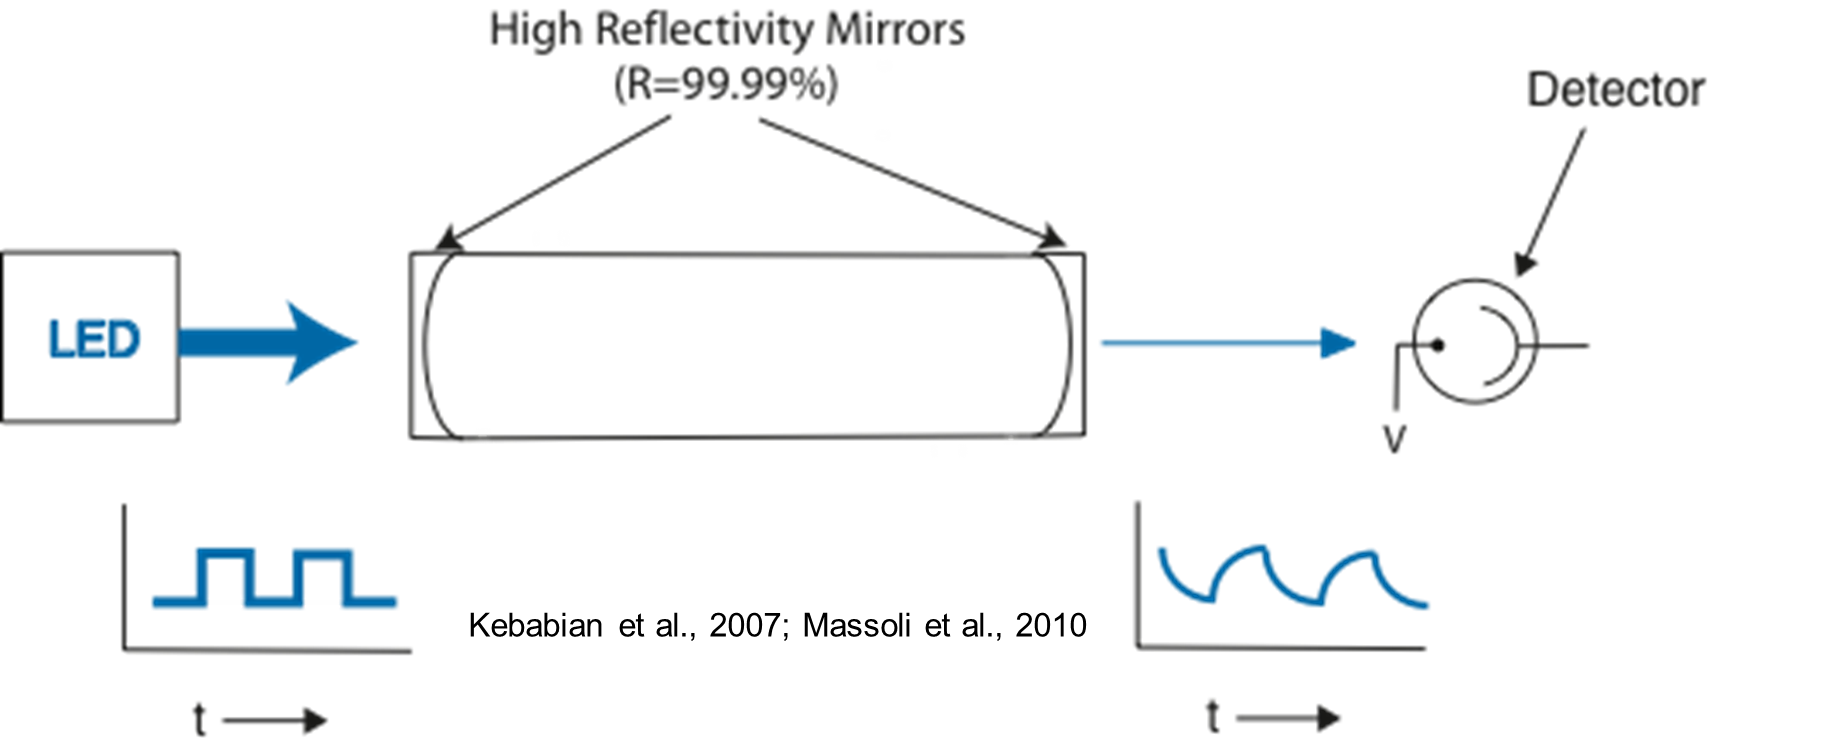
207 KB | Figure 3: Left: operation principles and key components of the CAPS method (LED wavelength 630 nm for CAPS PM<sub>EX</sub> and 450 nm for CAPS NO<sub>2</sub>); Right: schematic of the signal generation in a CAPS instrument. | 1 |
| 07:18, 7 September 2020 | EP-D1.4-Fig3B-CAPS-signal.png (file) |  |
33 KB | Figure 3: (...) Right: schematic of the signal generation in a CAPS instrument. | 1 |
| 05:00, 8 September 2020 | EP-D1.2-Fig0A-EMSO-FIXO3.jpg (file) |  |
15 KB | No caption. Category:Images | 1 |
| 05:01, 8 September 2020 | EP-D1.2-Fig0B-EMSO-FIXO3.jpg (file) |  |
20 KB | No caption. Category:Images | 1 |
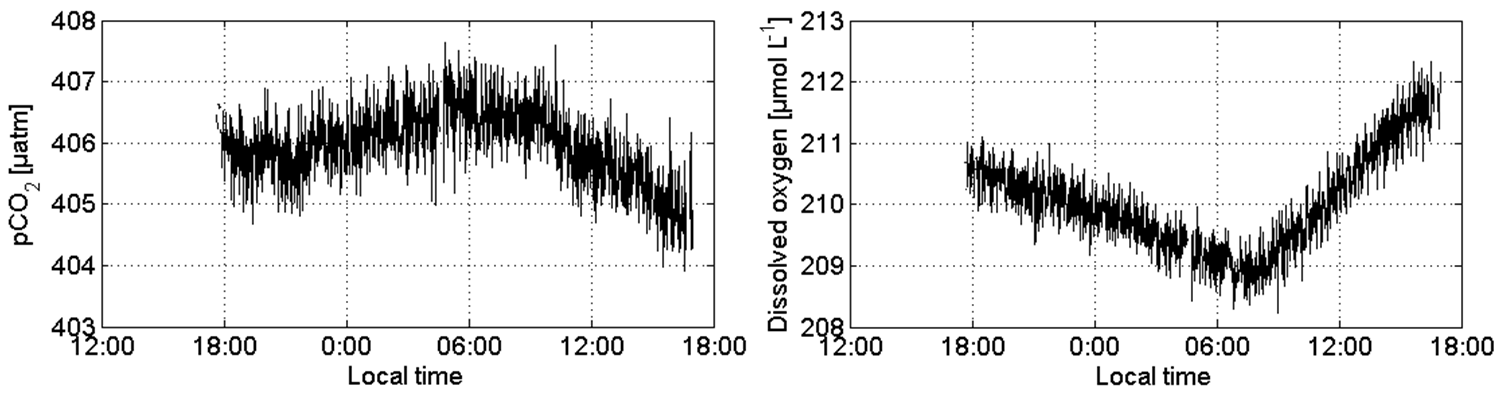
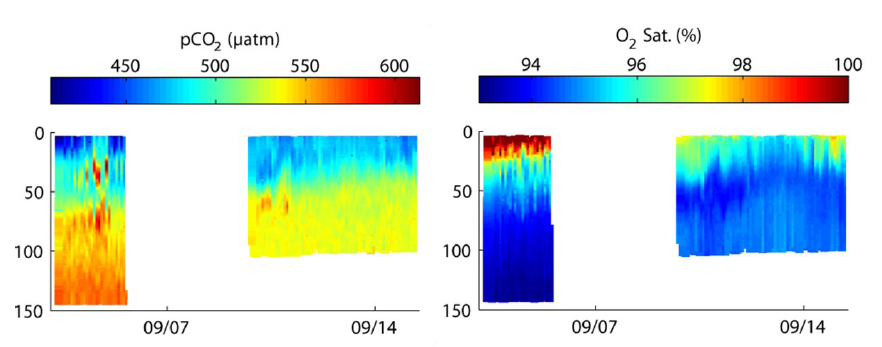
| 05:02, 8 September 2020 | EP-D1.2-Fig1-Mixed-layer-cycles.png (file) | 120 KB | Figure 1: Mixed layer diel cycles of pCO<sub>2</sub> (left) and O2 (right) observed with a Lagrangian surface-tethered drifter with biogeochemical sensor package (S, T, pCO<sub>2</sub>, O2, nitrate, chlorophyll) in the southern Indian Ocean during R/V... | 1 | |
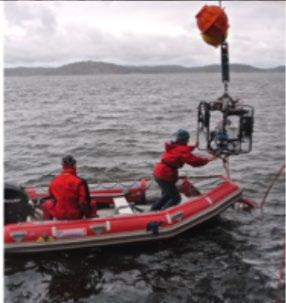
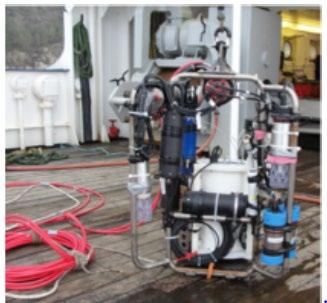
| 05:03, 8 September 2020 | EP-D1.2-Fig2-Koster-fjord-results.PNG (file) |  |
250 KB | Figure 2: Results from two test deployments of the moored submersible winch system with biogeochemical profiler (T, S, O2, pCO<sub>2</sub>, chlorophyll) in the Koster Fjord near the Sven Lovén Centre for Marine Infrastructure in Tjärnö/Sweden in Sep... | 1 |
| 05:04, 8 September 2020 | EP-D1.2-Fig3-Wave-glider-results.png (file) |  |
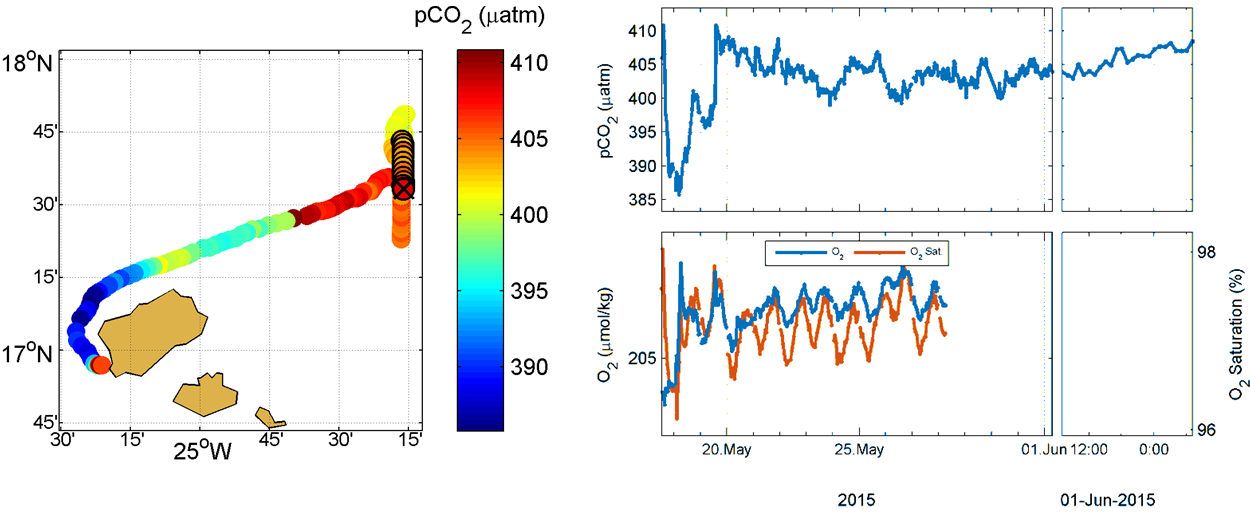
163 KB | Figure 3: Results of a successful deployment of the Liquid Robotics Wave Glider with biogeochemical sensor package (T, S, O2, pCO<sub>2</sub>, gas tension, chlorophyll) in the open ocean around the Cape Verde archipelago off West Africa in May/June 201... | 1 |
| 05:04, 8 September 2020 | EP-D1.2-Fig4-Instrument-comparison.png (file) |  |
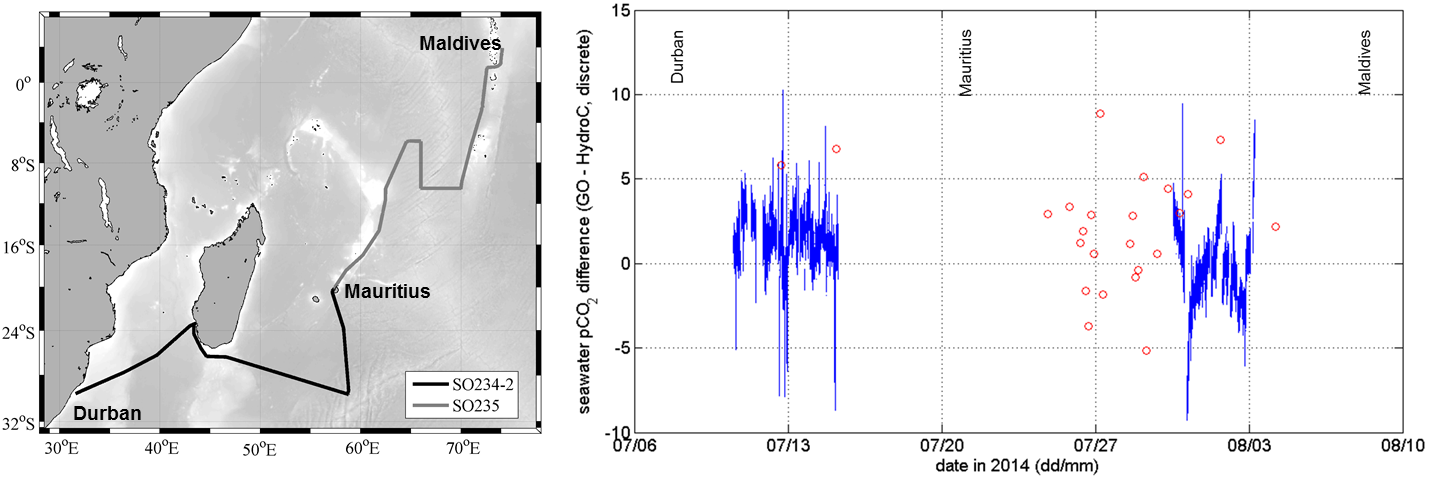
228 KB | Figure 4: Comparison of pCO<sub>2</sub> data acquired in underway mode with two different pCO<sub>2</sub> instruments (GO 8050 pCO<sub>2</sub> system (reference) and KM CONTROS HydroC pCO<sub>2</sub> sensor) during the R/V SONNE Cruises SO234/2 and SO2... | 1 |
| 05:05, 8 September 2020 | EP-D1.2-Fig4bis-First-NEMO-float.jpg (file) |  |
47 KB | First profiling float (NEMO model) equipped with a standalone KM CONTROS HydroC sensor and its battery pack – GEOMAR and KM CONTROS collaboration - 2010 data agree better than 3 µatm with both the reference pCO<sub>2</sub> system and the pCO<sub>2</... | 1 |
| 05:06, 8 September 2020 | EP-D1.2-Fig5A-HydroFlash-optode.jpg (file) |  |
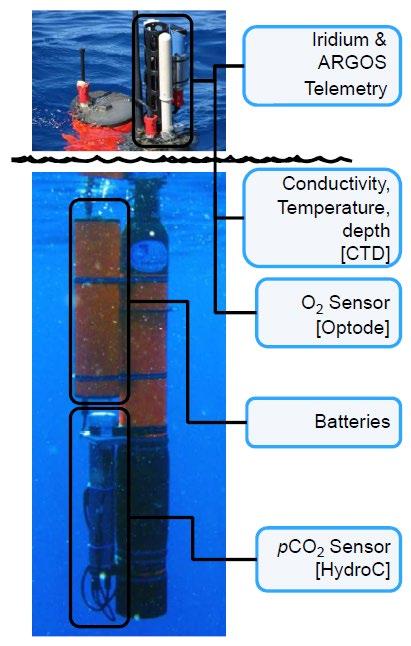
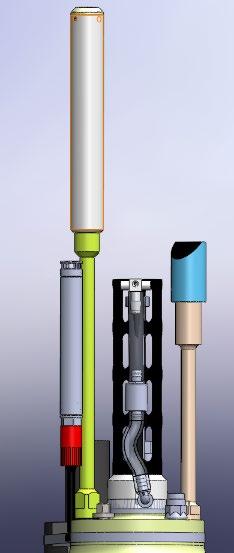
15 KB | Figure 5: (A) Schematic arrangement of the CONTROS HydroFlash® O2 optode next to the CTD and Aanderaa optode on a PROVOR float. (...) Category:Images | 1 |
| 05:07, 8 September 2020 | EP-D1.2-Fig5B-PROVOR-float.jpg (file) |  |
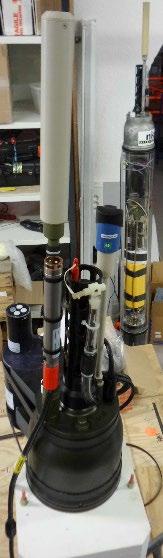
20 KB | Figure 5: (...) (B) Successful proof-of-concept float (PROVOR) implementation of a CONTROS HydroFlash® O2 optode as a precursor for further work on pCO<sub>2</sub> optodes. (...) Category:Images | 1 |
| 05:11, 8 September 2020 | EP-D1.2-Fig5C-First-optode-profile.jpg (file) |  |
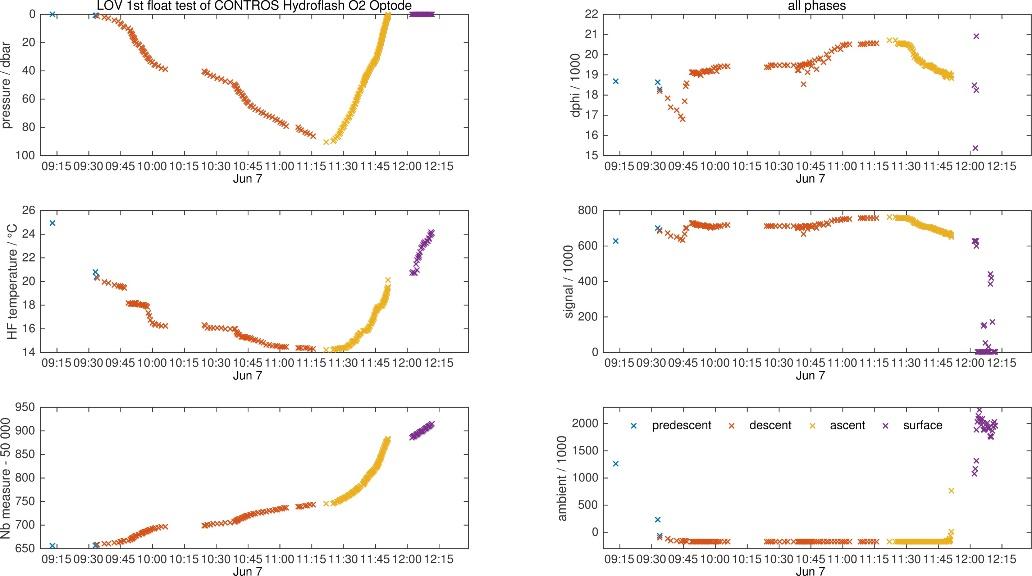
73 KB | Figure 5: (...) (C) First profile of the CONTROS HydroFlash® O2 optode recorded during the test deployment (Drawing and figures kindly provided by Christoph Penkerc'h/LOV and Henry C. Bittig/LOV). Category:Images | 1 |
| 05:13, 8 September 2020 | EP-D1.2-Fig6A-M133-measurements.png (file) |  |
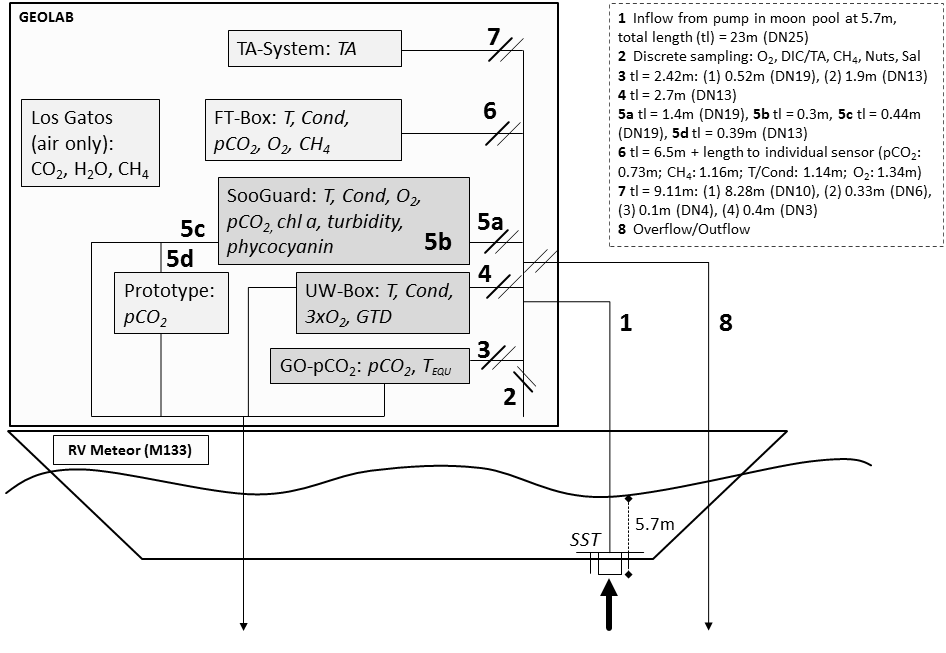
44 KB | Figure 6: (A) Schematic overview of all underway measurements carried out during the research cruise M133 of R/V Meteor. The CONTROS pCO<sub>2</sub> prototype (flow line 5d, red box) was arranged directly behind optical pCO<sub>2</sub> measurements fro... | 1 |
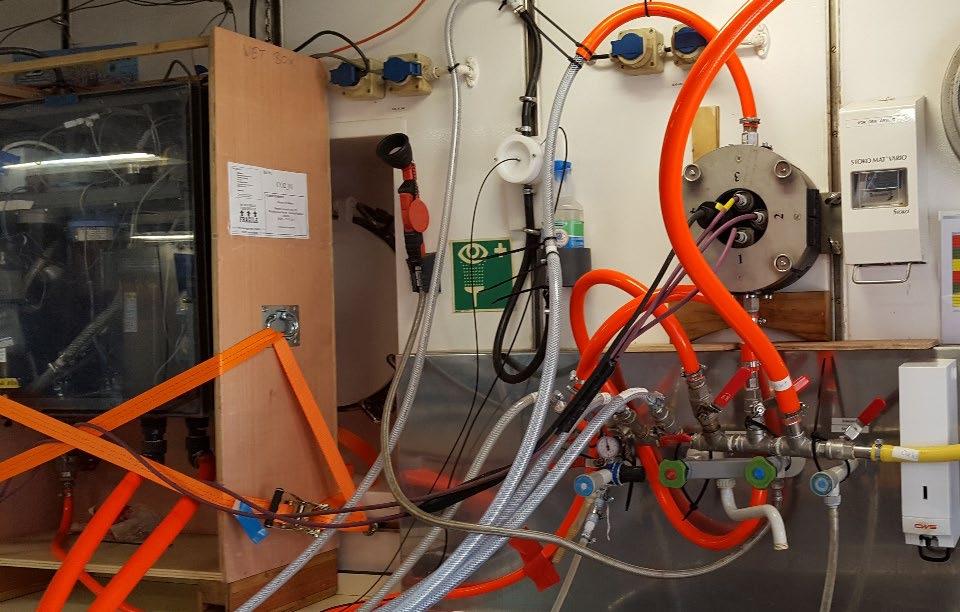
| 05:14, 8 September 2020 | EP-D1.2-Fig6B-pCO2-GO-arrangement.jpg (file) |  |
101 KB | Figure 6: (A) Schematic overview of all underway measurements carried out during the research cruise M133 of R/V Meteor. The CONTROS pCO<sub>2</sub> prototype (flow line 5d, red box) was arranged directly behind optical pCO<sub>2</sub> measurements fro... | 1 |
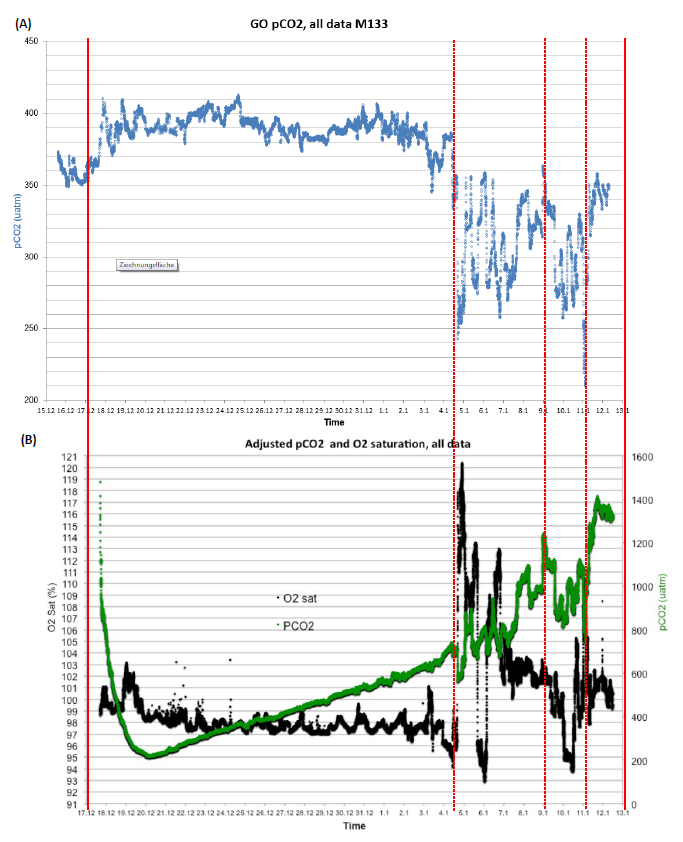
| 05:15, 8 September 2020 | EP-D1.2-Fig7-M133-pCO2-data.PNG (file) |  |
190 KB | Figure 7: Reference pCO<sub>2</sub> data from the GO underway pCO<sub>2</sub> system (A) and the Aanderaa pCO<sub>2</sub> optode (B, green symbols) as recorded between 15.12.2016 and 13.1.2017 over the course of the M133 cruise of R/V Meteor. After a t... | 1 |
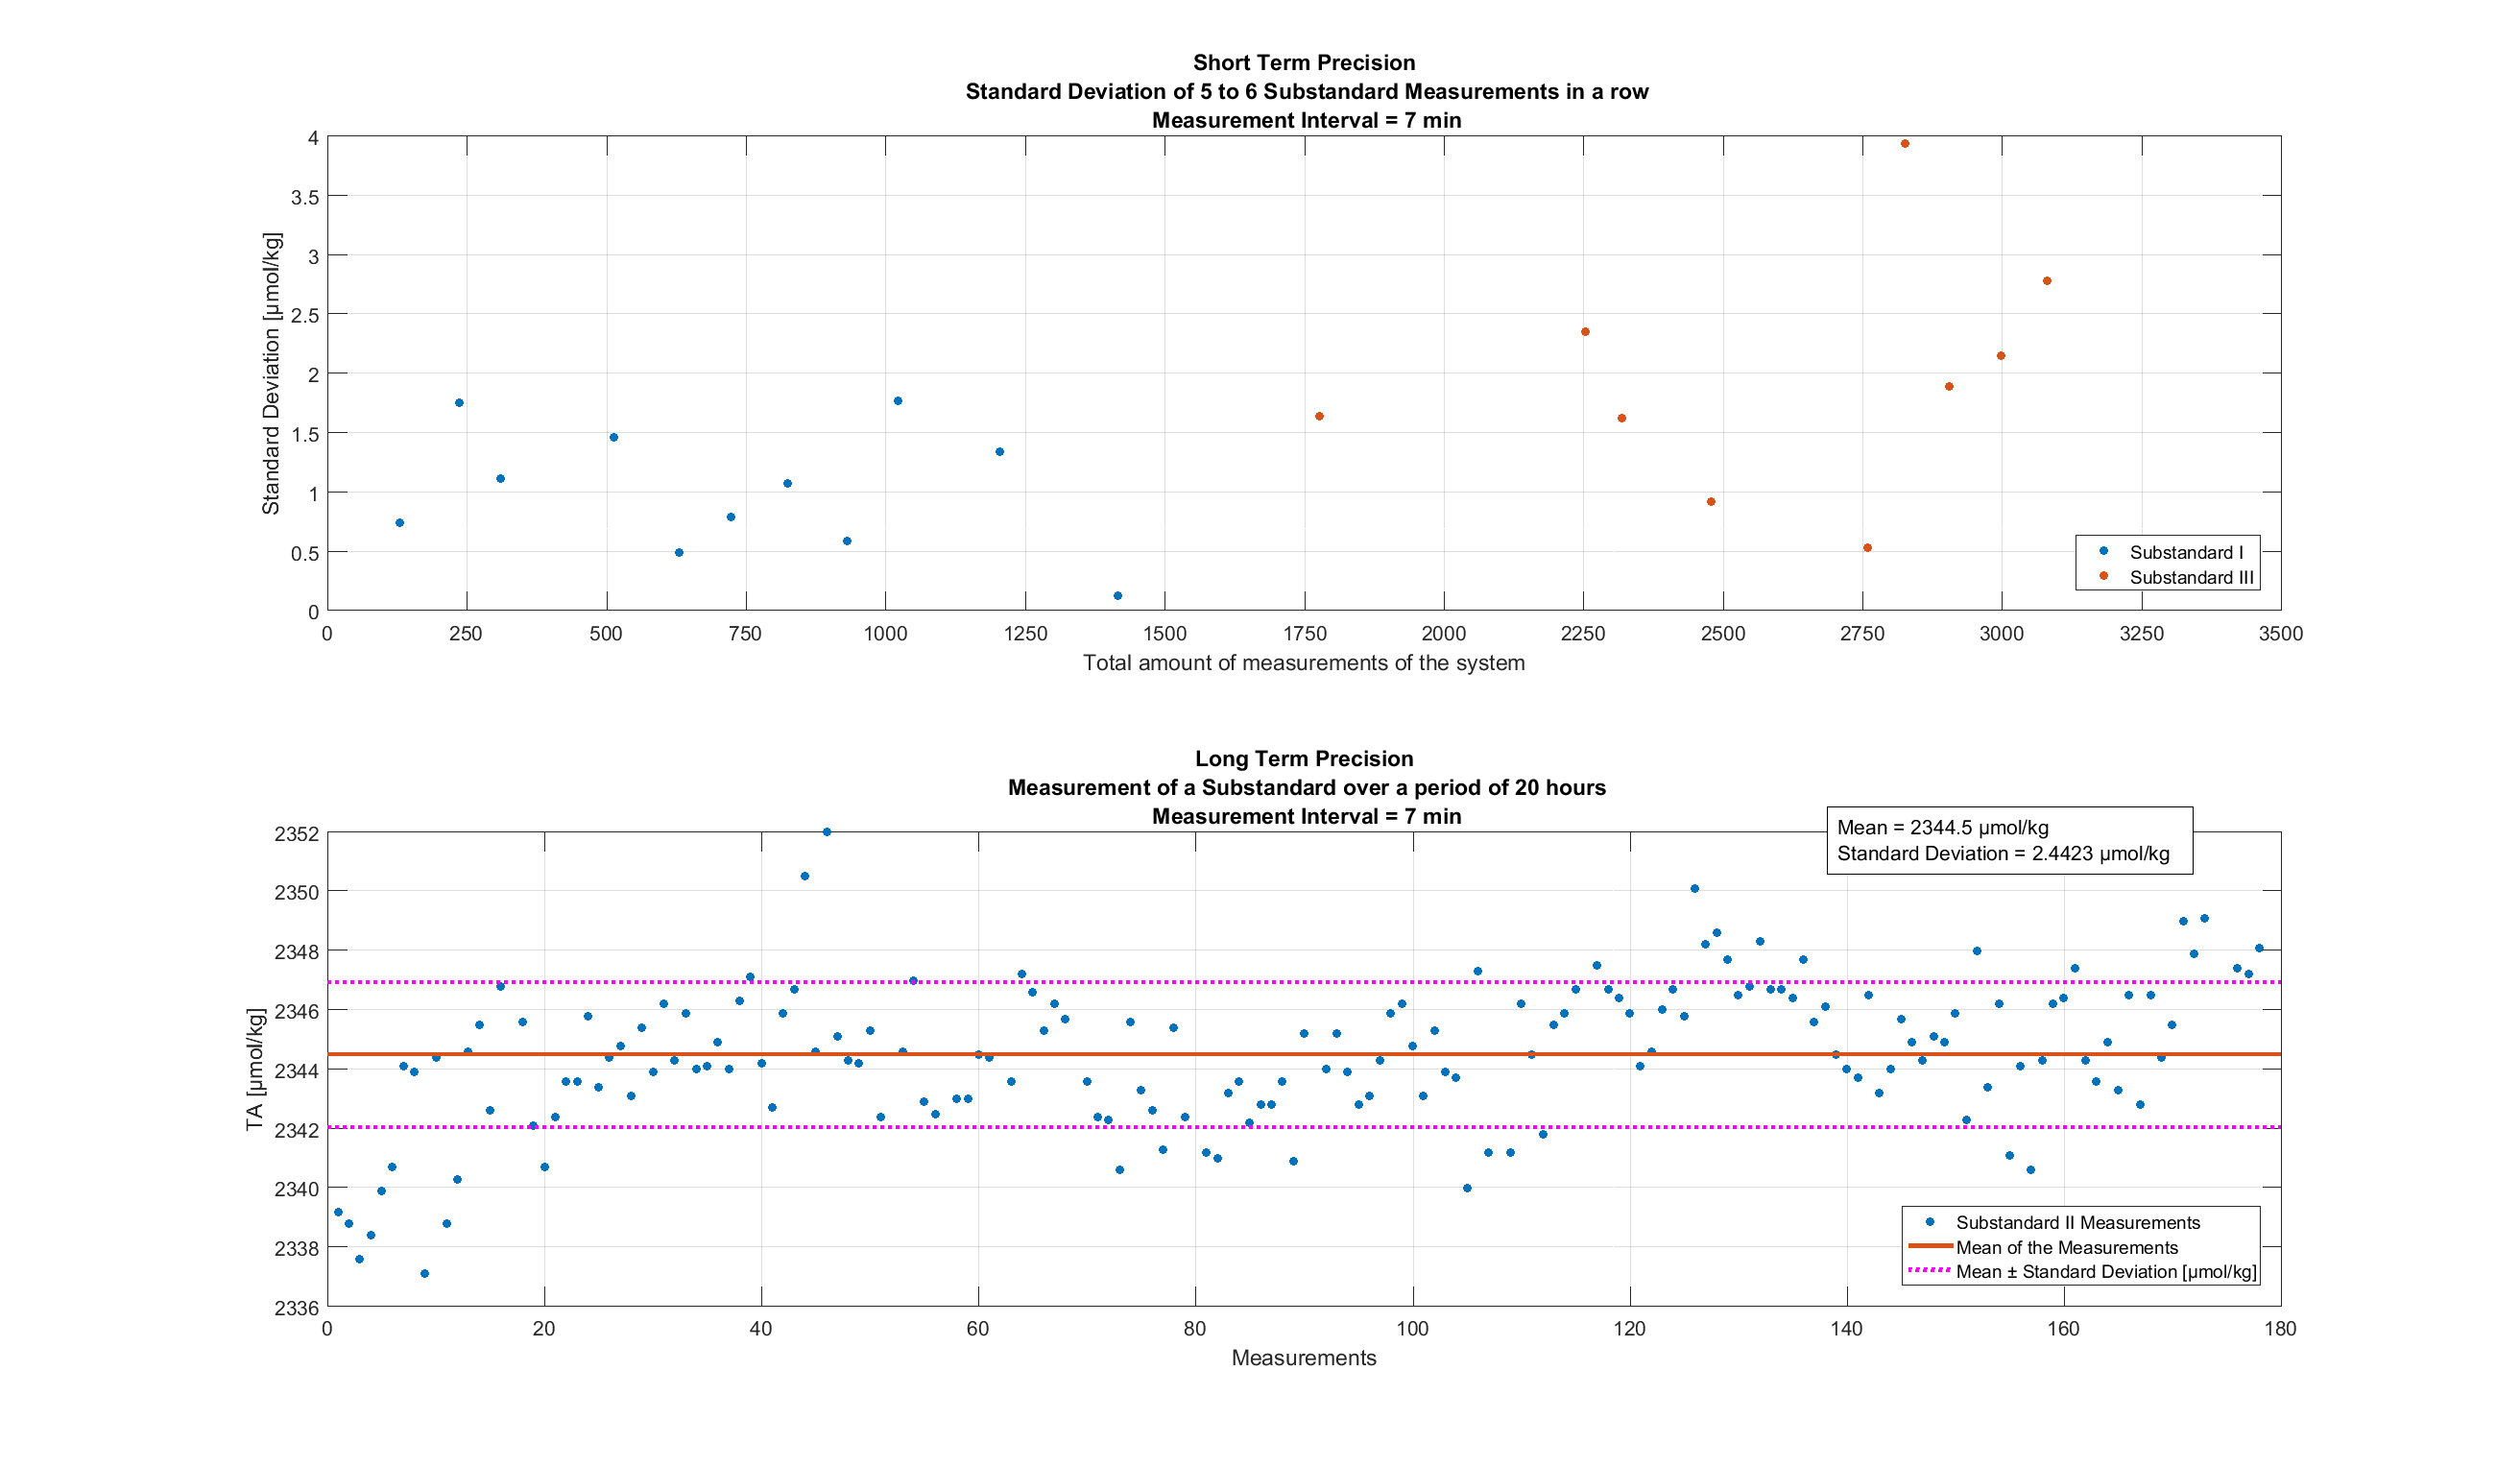
| 05:16, 8 September 2020 | EP-D1.2-Fig8-M133-precision-figures.png (file) |  |
125 KB | Figure 8. Short Term and Long Term Precision of the KM CONTROS HydroFIA TA system (Cruise M133) Category:Images | 1 |
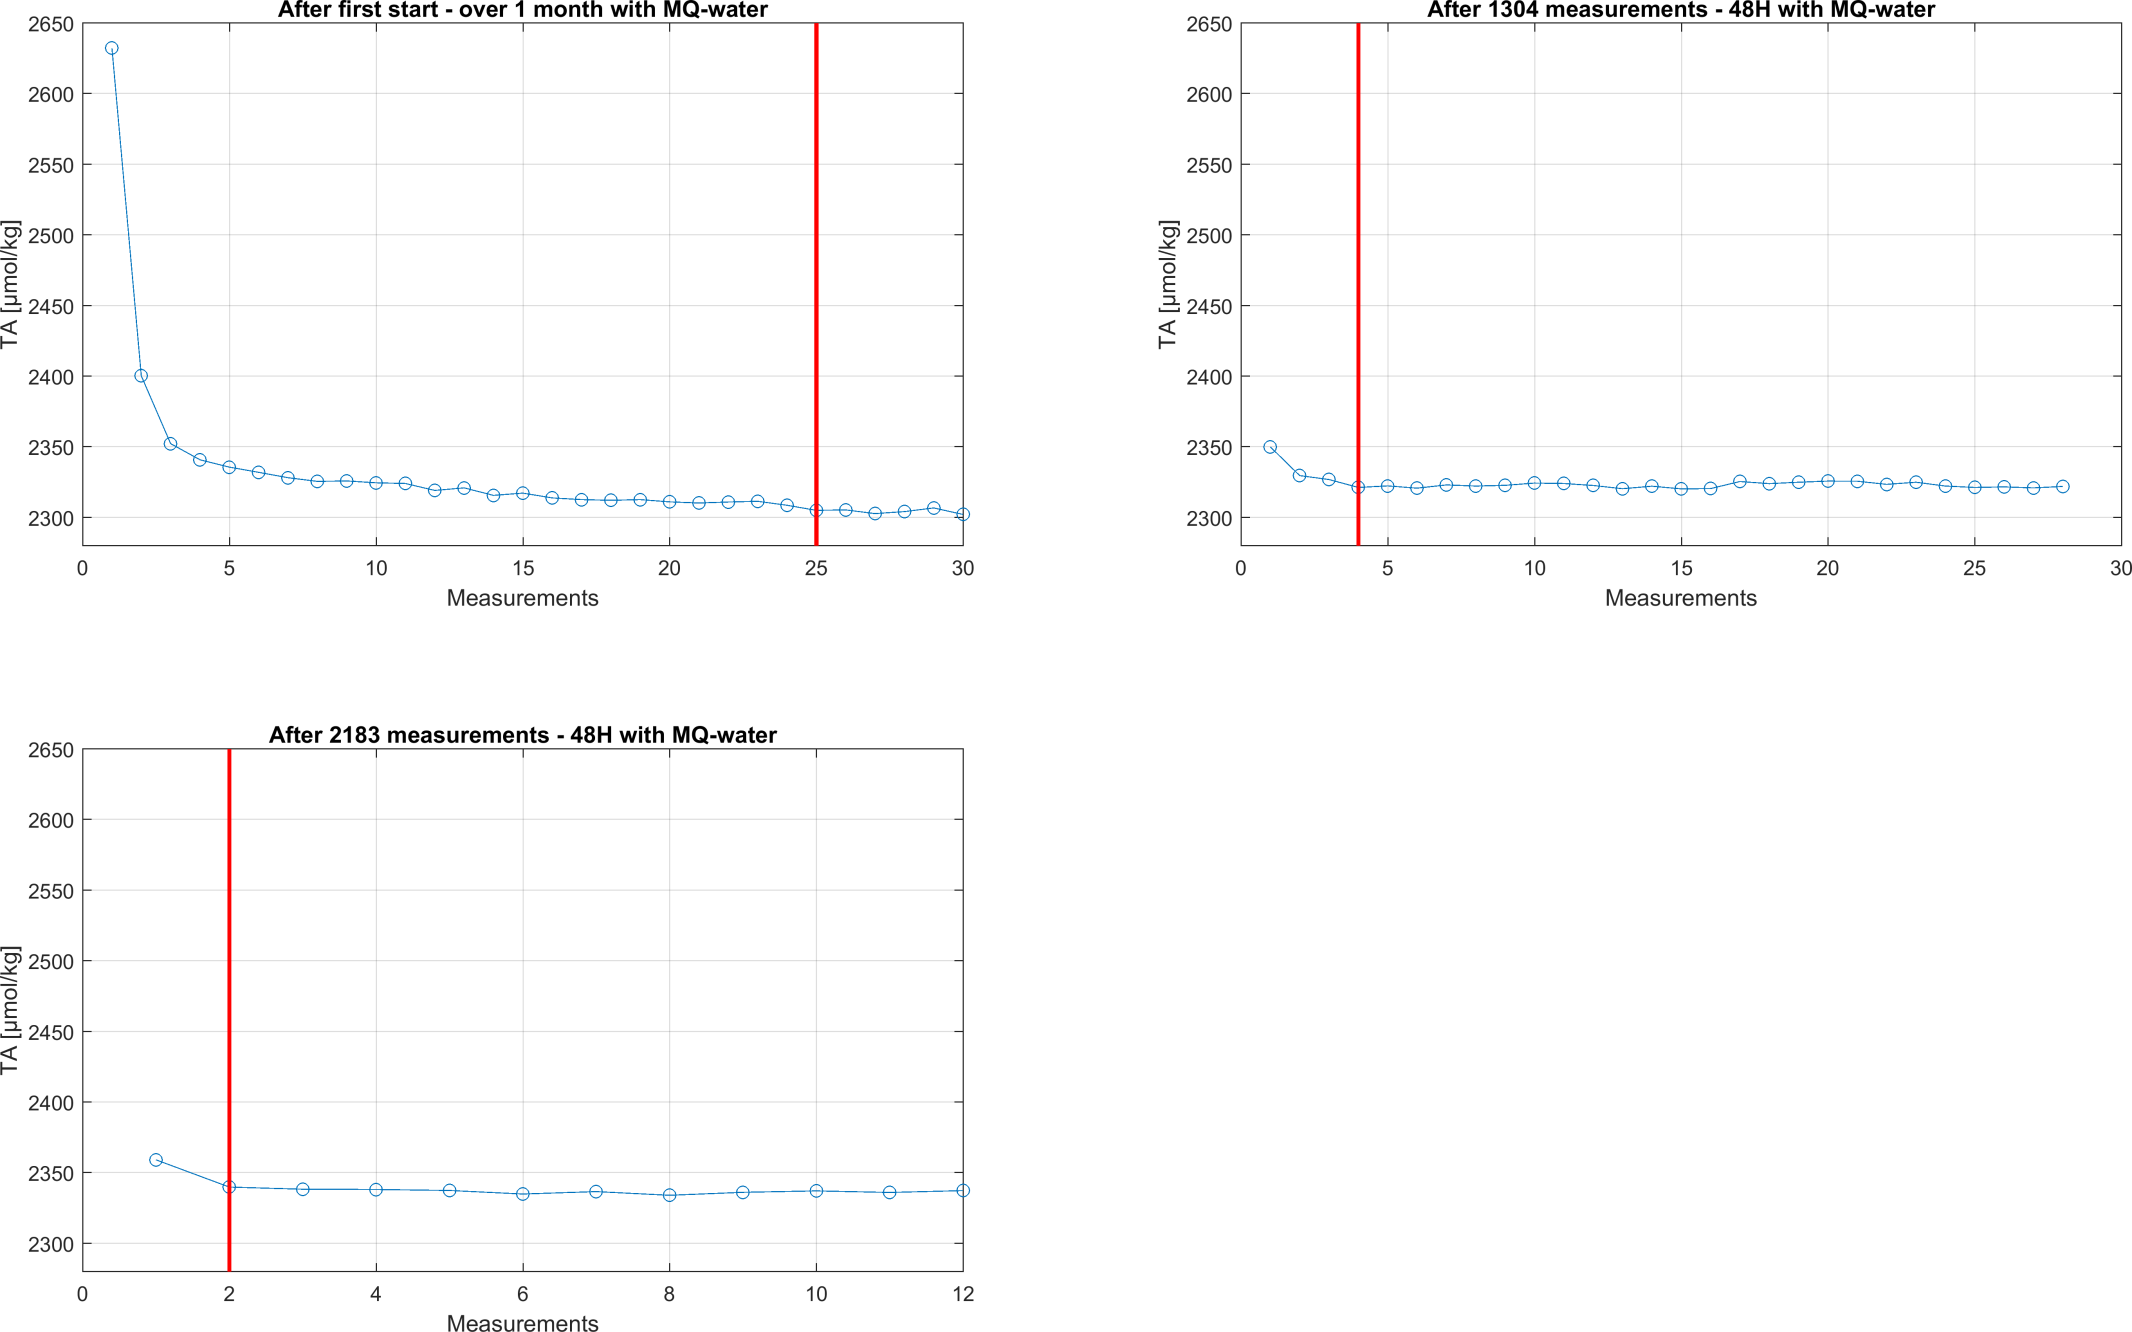
| 05:17, 8 September 2020 | EP-D1.2-Fig9-Post-MQflush-behavior.png (file) |  |
155 KB | Figure 9: Behaviour of the drift after MQ-Flush of the system (measurements after red vertical line = stable (Std-Dev. < 2 µmol/kg)) Category:Images | 1 |
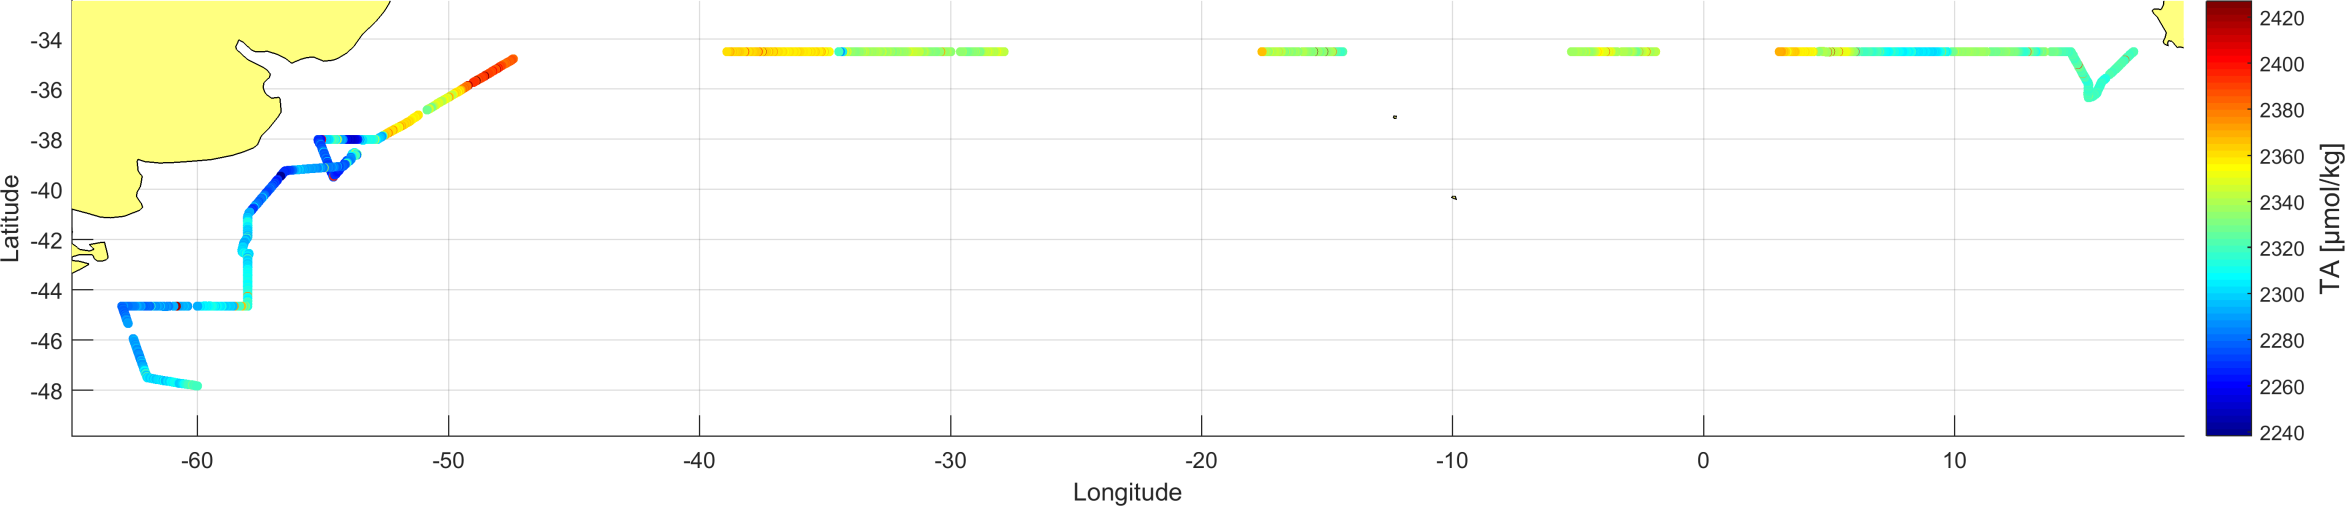
| 05:17, 8 September 2020 | EP-D1.2-Fig10-Total-alkalinity.png (file) | 89 KB | Figure 10: Total Alkalinity of the underway seawater measurements over the Cruise Track (Gaps = Experiments were carried out) Category:Images | 1 | |
| 05:19, 8 September 2020 | EP-D1.2-Fig10bisA-Float-deployment.jpg (file) |  |
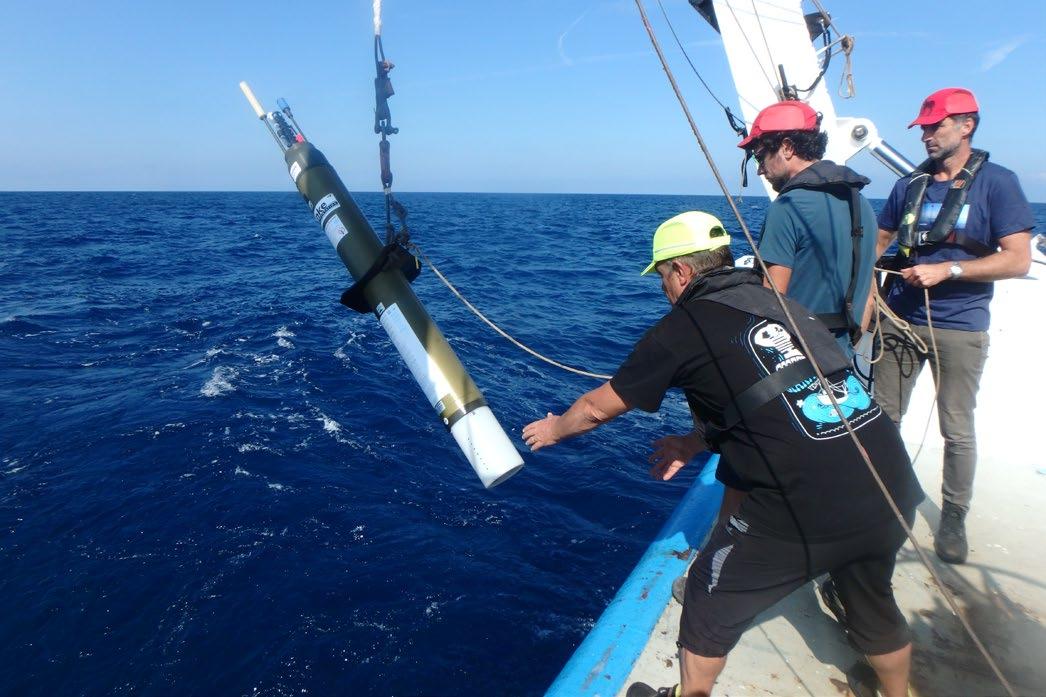
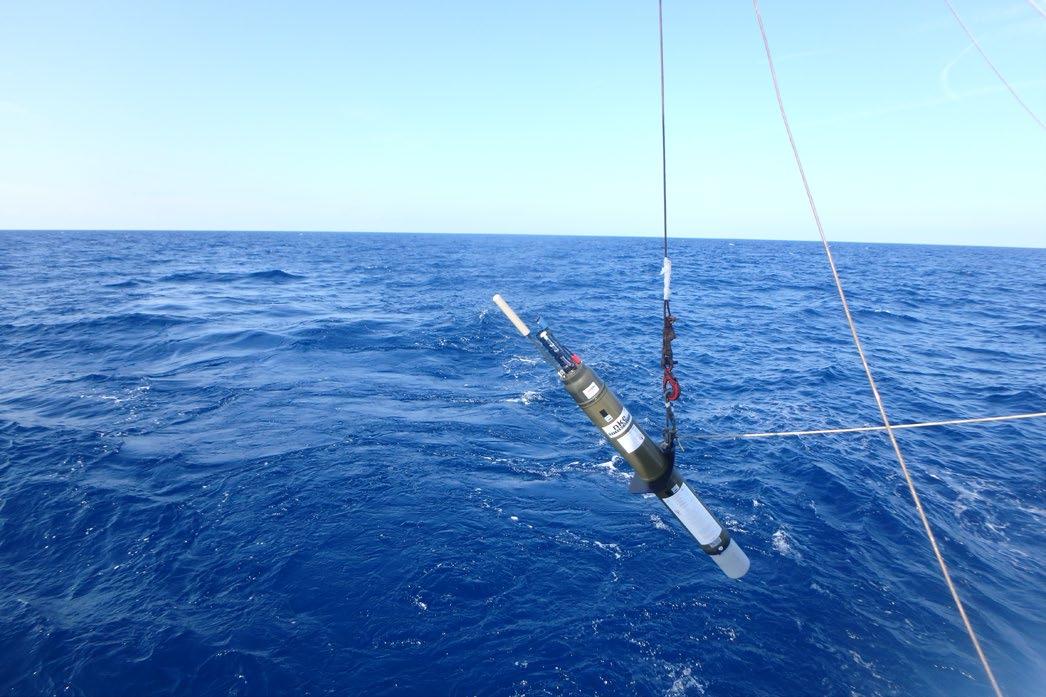
105 KB | Figure: Deployment of the profiling float at BOUSSOLE site in Ligurian Sea Category:Images | 1 |
| 05:19, 8 September 2020 | EP-D1.2-Fig10bisB-Float-deployment.jpg (file) |  |
116 KB | Deployment of the profiling float at BOUSSOLE site in Ligurian Sea Category:Images | 1 |
| 05:20, 8 September 2020 | EP-D1.2-Fig10bisC-Float-locations.png (file) |  |
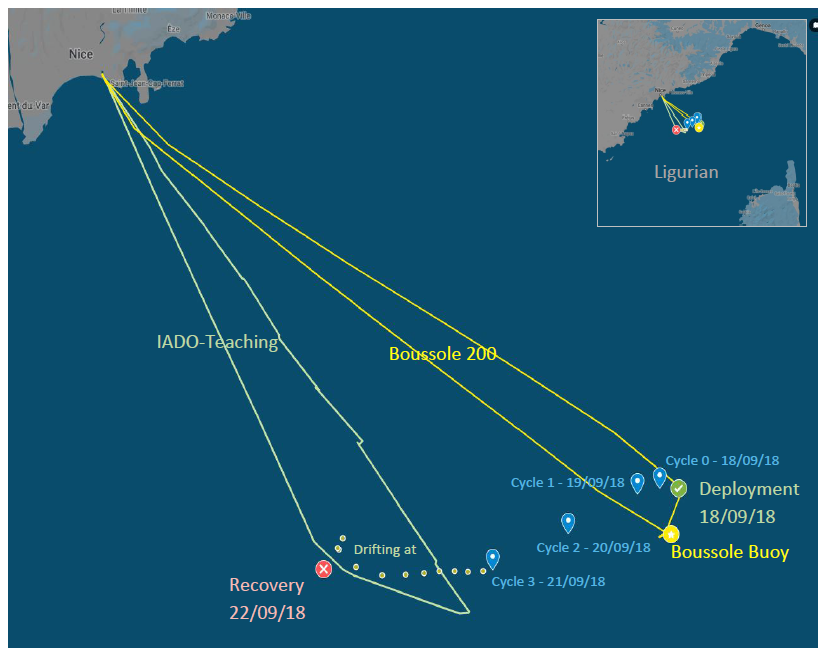
236 KB | Deployment and recovery of the pCO<sub>2</sub> profiling float prototype in the Ligurian Sea during BOUSSOLE/MOOSE/IADO-Teaching cruise. Blue symbols are the float's location at the end of each corresponding cycle. Category:Images | 1 |
| 12:15, 26 October 2020 | Categories bar example.png (file) | 14 KB | An example image of the categories bar. | 1 | |
| 12:34, 26 October 2020 | Top-level categories example.gif (file) |  |
789 KB | A short animation of folding open top-level categories on the Main Page. | 1 |
| 12:37, 26 October 2020 | Search bar and edit controls example.png (file) | 10 KB | An image depicting the search bar and page edit tabs. | 1 |
_and_stages_of_the_technological_product.png)