Search results
Create the page "LIDAR" on this wiki! See also the search results found.
Page title matches
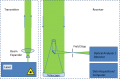
File:EP-D1.4-Fig1-LIDAR-setup.png Figure 1: Principle setup of a LIDAR system. Modified from (Weitkamp, 2005).(1,457 × 963 (82 KB)) - 05:17, 7 September 2020
File:D1.4-Report-on-integration-across-networks-common-strategy-and-common-sensors-for-lidar-and-aerosol-extinction-measurements.pdf (3.55 MB) - 08:46, 7 April 2021File:D1.4. Report on integration across networks common strategy and common sensors for LIDAR and aerosol extinction measurements.pdf (3.55 MB) - 14:34, 12 April 2021

Page text matches
File:EP-D1.4-Fig1-LIDAR-setup.png Figure 1: Principle setup of a LIDAR system. Modified from (Weitkamp, 2005).(1,457 × 963 (82 KB)) - 05:17, 7 September 2020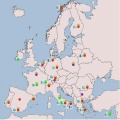
File:EP-D1.4-Fig2-EARLINET-stations.jpg ...rlinet stations currently active. Red dots indicate multi wavelength raman LIDAR stations (EARLINET core stations). Green dots correspond to stations with a(738 × 735 (73 KB)) - 05:17, 7 September 2020
File:EP-D1.4-Fig5B-Bornholm-Bremerhaven.jpg ...measured by a sun photometer in Lindenberg. The linear correlation CAPS vs LIDAR shows an linear factor of 0,79 which is corrected in this plot. This factor(663 × 1,173 (103 KB)) - 07:20, 7 September 2020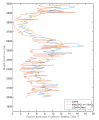
File:EP-D1.4-Fig6-Height-profiles.png ...measured by a sun photometer in Lindenberg. The linear correlation CAPS vs LIDAR shows an linear factor of 0,79 which is corrected in this plot. This factor(704 × 852 (54 KB)) - 07:20, 7 September 2020


